Availability of elements for heterogeneous catalysis: Predicting the industrial viability of novel catalysts
In the past century, huge advances have been made in industrial catalysis. Today, products of catalytic reactions contribute ca. 25% of the gross national product (GNP) in developed countries [1]. As the portfolio of catalysts grows, so does the number of industrially important catalytic reactions that use milder conditions and afford higher yields. A comprehensive list of current existing and emerging catalytic processes would be far too extensive to list here. Catalysis both improves economic returns and reduces the environmental impact of the chemical industry. Although many new catalysts have been described in the chemical literature, there is no general framework for predicting whether a new catalyst will be available in sufficient quantities to replace an existing catalyst. Currently, when proposing a new catalyst, researchers often have only the rudimentary average crustal abundance of a given element as a simple metric of technical availability. However, the crustal abundance can be an insufficient criterion for judging practical availability. Furthermore, the profitability and demand of a new catalytic product are difficult to predict. As catalyst application is ultimately a matter of economic consideration based on cost and efficiency, we now propose an improved analytic approach to determining catalyst viability based on the physical availability of sources (mineable ore streams) of a given element [2].
In the present study, we aim to equip researchers with a simple methodology to benchmark catalyst viability for a reaction and identify which catalytic elements could be substituted to create a more viable catalyst. Several factors determine catalyst compositions, including the supplier, chemical feedstock, cost of catalyst components, cost of feedstock, demand for the product and possible by-products, and local environmental legislation. Typically, catalysts are optimized for longevity with high selectivity. In some cases, particularly when the by-products are valuable, lower selectivity can be tolerated if purification is cost-effective. Based on these many factors, there is no clear way to define optimal general catalyst parameters. Therefore, catalysis offers plentiful opportunities for innovative research, as reflected in the ever-growing scientific literature in this field.
In this work, general conclusions are drawn based on an evaluation of currently employed catalysts for bulk chemical synthesis, current element availability, and estimated scalability.
The evaluation of the availability and scalability of elements is based on work published by Vesborg et al. [2], to which readers are referred for further detail. For consistency, element pricing and catalytic element consumption data are reported in US dollars (US$) from 2006, where possible.
Herein, we discuss the parameters important for predicting elements that are viable for catalysts at a given scale of industrial production. This discussion is based on selected catalytic reactions for which sufficient information on catalyst consumption was available. Although important, fine chemical synthesis is performed on a smaller scale at which catalyst availability is less likely to be the main limitation, and so is not included in this study. The selected case studies include various production scales, fuels, polymers, environmental catalysis, and a case in which the catalyst price proved limiting. Through our analysis, we have attempted to categorize catalysts as "unviable", "viable", or "highly viable". We also discuss the treated elements in order of availability (primary production of element per year) using the term log(p), as introduced by Vesborg et al. [2], which is the base 10 logarithm of the annual production in kg/y. In this work, we also introduce the metric "catalyst consumption to availability ratio per annum" (CCA), which is the quantity of an element consumed by a catalytic reaction per year (in kg/y) as a ratio of the total production of that element (in kg/y). This ratio, which describes physical availability limitations, must be lower than 1.0 for any real processes, but may well be larger for hypothetical processes. Consumption refers to net consumption, which accounts for recycling of catalyst elements. The second metric introduced is the "consumed catalyst cost to product value ratio per annum" (CCP), which must be much lower than 1.0 for the process to be economically profitable.
The CCA and CCP ratios allowed the estimation of the viability a catalyst system for industrial scale production via simple calculations based on catalyst loading, catalyst lifetime, and element availability and cost. We then showed, by example, how the CCA and CCP metrics can be used to determine viability limits for the scale of production, and the product price for a catalytic process. Furthermore, we extended the previous analysis to all elements in the periodic table for which sufficient data exists to determine alternative elements that could make the process viable if substituted into the catalyst, assuming activity is maintained.
As describing each catalytic reaction individually is not feasible here, detailed descriptions are provided in the Supporting Information (SI). Selected illustrative examples are discussed from each group of availability, namely, "very low", "low", and "high", grouped according to log(p).
For each reaction evaluated, we estimated the net amount of catalyst consumed per year before normalizing to either kg of product produced or the market value of that product. The net catalyst consumption was calculated from the amount of catalyst needed for annual production subtracted by the amount of catalyst annually recycle and then divided by the catalyst lifetime.
2.2 Assessment of recycling lifetime
Catalyst recycling can occur either on-site, through catalyst regeneration, or off-site, such as for noble-metal catalysts used in automobiles and nitric acid production. To address the effect of regeneration and recycling to the fullest extent possible in a simple estimate of lifetime, we divided the amount of catalyst loaded into a reactor by the number of years it can be extended to run with regeneration. For example, for SiO2-supported VOx catalysts used for H2SO4 production, 10% of the catalyst is exchanged every 1–3 y [3]. Therefore, assuming the lower bound, the total catalyst amount is fully exchanged every 10 y. As another example, the Fischer-Tropsch (FT) reaction needs regeneration every 7, 000 h, which extends the total lifetime to 5 y [4]. Finally, we present Pt consumption in automotive catalysts as a case study in which recycling of the active element plays a dominant role in catalyst consumption. Based on reports by Johnson Matthey [5] and Impala [6], both from 2013, the Pt demand was 104, 000 kg annually, while recovery/recycling of used catalysts amounted to 34, 000 kg, making the net Pt consumption 70, 000 kg. This includes demand due to losses, nonrecycled catalyst converters, and new catalyst converters.
2.3 Catalyst price estimates
Estimating the precise cost of a catalyst is important. The metal cost is only a fraction of the total catalyst cost, which often includes metal impregnation, wash-coating, reduction, and co-catalysts, such as zeolites. Metal prices will likely scale, at least to within an order of magnitude, with the total catalyst cost. These differences in preparation costs should be included in an advanced life-cycle analysis, but are beyond the scope of this study. Instead, we include these factors in an implicit manner, assuming, as a first approximation, that the costs for catalyst processing from mined metal oxide to finished catalyst are similar for all treated industrial processes. As catalysts based on zeolites require much higher processing costs than more common catalysts based on supported metals, we have not addressed zeolite catalysts in this study. Furthermore, the prices of Al (US$2.0/kg) and Si (US$2.5/kg) used in this study are that of the element, not the oxide, with the former being closer to the cost of a zeolite (US$0.075–0.3/kg for natural zeolites [7]) than to that of the unpurified mined oxide. A second-generation estimate based on this work (using the calculations spreadsheet in the SI) could easily include the average cost of various synthetic/natural zeolites in place of elemental Si/Al. As this study aims to provide an early stage evaluation of catalyst viability, the inclusion of more detailed catalyst costs is beyond the current scope.
2.4 Process costs and specific activity
In the latter section of this work, we use guidelines described here to predict a second generation estimate of viability for elements not currently explored in catalysts. Catalyst activity is known to be logarithmically dependent on the binding energy of the key intermediate in a volcano plot. Therefore, the chemistry and activity of each element vary greatly. In this work, the effect of catalyst element substitution on activity is not included in the CCA and CCP estimates, but other catalytic elements that would not be limited by their availability for the specific catalytic process are indicated. Therefore, it is incumbent upon the catalysis researcher to investigate the activity, optimal process conditions, and corresponding final viability of the new catalyst.
The approximations used for calculating catalyst consumption in each reaction are described in detail in the SI, and the results are listed and discussed below.
3.1 Very low production volume elements (log(p) ≤ 6)
The very low production volume elements, which have a net primary production of less than 1, 000 t/y, are of particular interest in catalysis because they include highly catalytically active Pt group metals (PGMs) and Re. The log(p) values of for Pt, Pd, Rh, Ir, Re, and Ru are 5.3, 5.3, 4.4, 4.0, 4.7, and 4.4, respectively, meaning, for example, that the annual production of Rh is 104.4 kg/y.
These metals, though scarce, are used in several processes, including bulk chemical production, such as HNO3 production and chlor-alkali production, and, perhaps most importantly, automotive exhaust treatment. The automotive catalyst sector is the largest end-user of PGMs Pt, Pd, and Rh (39% in 2003 [6]) [8, 9]. In gasoline engines, Pd and Pt are used interchangeably (depending on cost) to oxidize CO and hydrocarbons to CO2. Notably, Pd has almost supplanted Pt in gasoline engine catalysts in the last decade due to its lower price. Rh is added to catalyze the reduction of NOx to nitrogen. For diesel engines, only about 30% of Pt can be replaced with Pd due to the more oxidizing environment and lower temperature of diesel exhaust. In the latter case, Pt and Pd catalyze the oxidation of CO and unconverted diesel, but NOx are removed using separate selective catalytic reduction (SCR) catalysts. SCR catalysts are not mounted on all diesel engines and are therefore not included in this work (SCR in power plants is treated separately below). To achieve the high conversions required by global environmental legislation, the catalyst feed gas composition is carefully computer controlled. These complex catalyst systems are mounted on vehicles sold worldwide, including light duty gasoline/diesel vehicles, heavy-duty vehicles, and non-road mobile machinery. To estimate the number of gasoline catalysts produced annually, we used the global car production of around 81 million units [8]. Therefore, the catalyst element consumption rates become 7.0×10⁴ kg Pt/y, 1.5×10⁵ kg Pd/y, and 1.6×10⁴ kg Rh/y, respectively. These figures are net consumption rates accounting for the 3.4×10⁴, 4.9×10⁴, and 8.0×10³ kg of Pt, Pd, and Rh recycled annually, respectively [5, 6]. Calculated noble-metal loadings for each catalytic converter yielded values in good agreement with typical reported noble-metal loadings [9].
As an example of an industrial process that has been investigated but not implemented, we also evaluated ammonia production [10, 11] using a Ru catalyst. Ammonia production using Ru has only found modest application as a second-step conversion reactor with an installed capacity of 2.7×10⁹ kg/y in 2017 (or 1.7% of global annual production) according to catalyst producer KBR [12]. This process is called the Kellogg Advanced Ammonia Process and is based on a conventional iron catalyst upstream followed by a Ru-on-graphite catalyst downstream. This limited application is likely due to the high consumption rate of Ru (vide infra), which is purportedly due to gasification of the carbon support. For illustration purposes, we calculated the elemental consumption rates for Ru-catalyzed ammonia production and assumed it could cover global ammonia production. This catalyst example is based on a patent for a boron nitride and magnesium oxide-supported BaO-doped Ru catalyst. Typical lifetimes of Ru-based catalysts are reported to be around 5, 000 h [10] and typical catalyst loadings are around 12.20 kg/(t NH3/d). Therefore, the resulting consumption rates were 8.9×10⁵ kg Ru/y, 1.1×10⁶ kg Ba/y, 3.7×10⁵ kg B/y, and 3.9×10⁶ kg Mg/y. The Ru consumption was 36 times larger than current Ru production (2.5×10⁴ kg/y [2]; CCA = 36 > > 1), which strongly suggested that such a process could not be industrially viable.
The above result, and those for chlor-alkali and HNO3 production (see SI), are summarized in Table 1.
表 1
(Table 1)
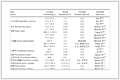
Table 1 Summary of catalytic reactions and their elemental consumption rate for very low volume of production catalyst elements.
| Process |
Catalyst |
Elemental consumption rate (kg/y)
|
Production (kg)
|
Market (US$)
|
Automotive catalyst
(diesel and gasoline)
|
Pd(/Pt)-Rh/Al2O3 and Pd-Pt/Al2O3
|
Pt |
Pd |
Rh |
|
8.10×10⁷a
|
1.21×10¹⁰b
|
| 7.01×10⁴
|
1.47×10⁵
|
1.62×10⁴
|
|
(cars)
|
|
| Ammonia production |
Ru-BaO/BN/MgO |
Ru |
Ba |
B |
Mg |
1.59×10¹¹
|
9.22×10¹⁰
|
| 8.86×10⁵
|
1.07×10⁶
|
3.68×10⁵
|
3.93×10⁶
|
|
|
| Chlor-alkali production |
Ru-Ir on TiO2 and Pt-Ru on Ni |
Ru (anode)
|
Ir (anode)
|
Pt (cathode)
|
Ru (cathode)
|
6.28×10¹⁰(Cl2)
|
1.78×10¹⁰ (Cl2)
|
| 2.00×10³
|
3.83×10³
|
5.06×10³
|
1.95×10³
|
3.54×10¹⁰ (NaOH)
|
1.49×10¹⁰ (NaOH)
|
| Nitric acid production |
Pt-Rh and Pd |
High-pressure
|
|
Dual-pressure
|
|
6.00×10¹⁰c
|
1.32×10¹⁰ c
|
| Pt |
Rh |
Pt |
Rh |
|
|
|
|
|
3.60×10³
|
6.63×10²
|
1.32×10³
|
2.43×10²
|
|
|
|
aAnnual production of catalytic converters approximated from number of cars produced per year rather than product mass. bAnnual market for catalytic converters approximated from external price (societal health cost) per catalyst unit. cProduction and market for HNO3 produced either through high-or dual-pressure routes calculated by assuming either process was responsible for combined global HNO3 production.
|
|
Table 1
Summary of catalytic reactions and their elemental consumption rate for very low volume of production catalyst elements.
|
3.2 Low production volume elements (log(p) = 6–9)
The low production volume elements include V, Co, and Zr. V is used in both SCR and sulfuric acid production, Co is used in the FT process, and Zr is used in the Ziegler-Natta (ZN) catalyst for polymer production.
The SCR reaction is used to clean NOx gas in exhaust gases from large-scale industrial processes, such as electricity production (power plants) and cement production [1, 9, 13]. The NOx gases are reduced selectively with ammonia to produce harmless N2 over a TiO2-supported VOx catalyst. These TiO2 particles are coated on honeycomb structures, similar to those used in automotive three-way catalysts, where each cassette of honeycomb catalyst can convert huge volumes of gas. No figures were available for global SCR capacity, so a value was estimated based on the amount of CO2 produced from global coal consumption (13 Gt of CO2 in 2010 [14]). The true value is likely lower because not all sources of coal combustion have SCR technology installed. In contrast, SCR technology is installed in some natural gas power plants and mobile sources, such as ships. These factors all contribute to the approximation of installed SCR capacity. The estimated elemental consumption rates are 2.4×10⁶ kg V/y and 4.7×10⁷ kg Ti/y. Notably, the SCR catalysts for heavy duty diesel vehicles are based on transition metal-loaded zeolites, such as Fe-β zeolites. As accurate data could not be found for commercial units, such as loadings and lifetimes, these SCR catalysts are not included in this work.
Co is among the catalyst used for the FT synthesis of fuels from synthesis gas (syngas, CO and H2 gas mixture) [4, 15-18]. The modern industrial FT reaction was developed by the Sasol Company in South Africa. Recently, this reaction has attracted more interest because syngas can potentially be obtained from renewable sources, making this a route toward renewable fuel. Currently, around 83% of all FT plants use a Fe, Cu, and K catalyst deposited on SiO2. However, plants using Co catalysts are increasing in number [18]. Promoters, such as 0.05–0.1 wt% Ru, Pt, Pd, or Re and 1–10 wt% Zr, La, or Ce oxides are often used [19]. As an example, we used a 0.5 wt% Re/10 wt% Co/Al2O3 catalyst, which resulted in a production rate of 0.42 kg hydrocarbon/h/kg catalyst, giving estimated element consumption rates of 1.1×10⁴ kg Co/y, 5.4×10² kg Re/y, and 7.1×10⁴ kg Al/y for Co-catalyzed FT synthesis, which were in good agreement with previous literature estimates (vide infra) [19].
Zr-metallocenes promoted by methylaluminoxane are active components in the sixth-generation ZN catalyst. This catalyst affords highly stereoregular (isotactic or syndiotactic) polypropylene (PP). This high level of control is valuable for industrial application, allowing tailoring of the physical product properties. The scale of industrial ZN catalysis implementation was estimated from the 2012 global capacity of 62 Mt/y polypropylene [20] (a major polymer product). Although Zr-based ZN catalysts are probably not used for all polypropylene production, other polymers can be produced using this technology, resulting in an approximate scale for a complex field comprising multiple catalysts. The catalyst productivity is estimated as 5×10⁶ kg polymer/kg catalyst metal with no recovery [21]. As the catalyst composition is 0.2 wt% Zr, 7.5 wt% Al, and 92.3 wt% SiO2 (disregarding organic ligands), the estimated annual consumption rates are approximately 3.2×10² kg Zr, 1.2×10⁴ kg Al, and 7.0×10⁴ kg Si.
Table 2 summarizes the elemental consumption rates given above, and those for sulfuric acid production (see SI).
表 2
(Table 2)
Table 2 Summary of elemental consumption rates for catalytic reactions using low production volume catalyst elements.
| Process |
Catalyst |
Elemental consumption rate (kg/y)
|
Production (kg)
|
Market (US$)
|
| FT (Co-based)
|
Co/SiO2
|
Co |
Re |
Al |
1.98×10⁹
|
1.55×10⁹
|
| 1.08×10⁴
|
5.38×10²
|
7.05×10⁴
|
|
|
| SCR |
VOx/TiO2
|
V |
Ti |
|
1.31×10¹³ a
|
2.19×10¹⁰
|
| 2.44×10⁶
|
4.73×10⁷
|
|
(kg CO2 emission)
|
|
| Sulfuric acid |
K-VOx/SiO2
|
V |
K |
Si |
1.65×10¹¹
|
1.24×10¹⁰
|
| 2.88×10⁵
|
7.05×10⁵
|
2.72×10⁶
|
|
|
| Ziegler-Natta |
Zr(cyclopentadienyl)2 and methylaluminoxane on SiO2
|
Zr |
Al |
Si |
6.20×10¹⁰
|
1.20×10¹¹
|
| 3.22×10²
|
1.21×10⁴
|
6.95×10⁴
|
|
|
|
aCO2 from coal and combustion [11].
|
|
Table 2
Summary of elemental consumption rates for catalytic reactions using low production volume catalyst elements.
|
3.3 High production volume elements (log(p) > 9)
The high production volume elements include Cu, Al, and Fe. As these are the most abundant elements, they are used as both catalysts and supports. To account for heterogeneous acid catalysis, an important catalyst category, we have included the catalyst consumption for the Claus Process, which uses an Al2O3 catalyst. Al2O3 and SiO2 are also two of the most common catalyst supports, for which estimates of element production are skewed. Indeed, many the catalysts made from these elements are based upon intermediately purified precursors and not pure elements, which are the basis for the numbers presented here. In the absence of more suitable estimates, we tentatively used the former values for SiO2, Al2O3, and TiO2.
The final reaction treated here is the Fe-catalyzed FT reaction. This catalyst comprises 74 wt% Fe with Cu and K promoters supported on SiO2, and has a turn-over frequency three times lower than that of Co-FT catalysts [15]. Therefore, we applied the same approximations used for the Co-FT catalysts above, but increased the catalyst loading three-fold on a molar basis (0.1 kg Fe-catalyst/t fuel/y). The resulting consumption rates were estimated to be 1.5×10⁵ kg Fe/y, 7.4×10³ kg Cu/y, 1.7×10⁴ kg Si/y, and 3.1×10³ kg K/y.
Table 3 summarizes the consumption rates given above and those for the Claus, ammonia, and methanol processes (see SI).
表 3
(Table 3)
Table 3 Summary of elemental consumption rates for catalytic reactions using high production volume catalyst elements.
| Process |
Catalyst |
Elemental consumption rate (kg/y)
|
Production (kg)
|
Market (US$)
|
| Ammonia |
Fe-alloy |
Fe |
Al |
K |
Ca |
1.59×10¹¹
|
9.22×10¹⁰
|
| 2.45×10⁶
|
2.12×10⁴
|
1.21×10⁵
|
1.03×10⁵
|
|
|
| Claus process |
Al2O3
|
Al |
6.80×10¹⁰
|
1.51×10¹⁰
|
| 2.10×10⁶
|
|
|
| FT |
Fe/SiO2
|
Fe |
Cu |
Si |
K |
9.62×10⁹
|
7.51×10⁹
|
| 1.48×10⁵
|
7.38×10³
|
1.73×10⁴
|
3.06×10³
|
|
|
| Methanol |
Cu/ZnO/Al2O3
|
Cu |
Zn |
Al |
|
6.06×10¹⁰
|
2.70×10¹⁰
|
| 7.60×10⁵
|
3.04×10⁵
|
1.11×10⁵
|
|
|
|
|
Table 3
Summary of elemental consumption rates for catalytic reactions using high production volume catalyst elements.
|
3.4 Effect of price fluctuations
Transition metals make up a significant portion of total catalyst cost, whereas the silica or alumina on which they are supported tend to be less expensive. To estimate the cost of each catalyst, we used price estimates described by Vesborg et al. [2]. It should be noted that catalyst element prices may change yearly or even monthly not only due to demand, but also due to speculation on the metal exchange or shortages due to high demand. One such example of the latter two factors working together is the price of Rh (see Fig. 1), which rose dramatically in 2004 due to an increase in automobile production. This trend was purportedly reinforced by an OEM automotive supplier who decided to sell their stockpile to generate revenue in December 2005, and then later purchased large quantities of these raw materials, causing a shortage that further drove up prices [22]. In 2008, the Rh price plummeted, partly due to the general downturn in the financial markets. The particularly volatile nature of the Rh price is due to it being a low-abundance by-product of Pt production. This example illustrates two important points made in the analysis presented here: (1) the price of by-product elements (poorly scalable elements) may increase drastically if demand suddenly increases above supply, and (2) prices used in evaluations such as those suggested here should account for price evolution over time (averages).
The product output (kg/y) of the selected nine reactions treated in this study (minus the environmental processes) is plotted against the catalytic element consumption (kg catalyst/y) in Fig. 2. Environmental processes were omitted as there was no sensible/consistent way of assigning product mass for these reactions. As shown in Fig. 2, there was no simple relationship between the mass of the product generated and mass of the catalyst consumed across different industrial reactions. Therefore, the amount of product generated and amount of catalyst consumed were essentially uncorrelated. This meant that generalized statements, such as "the use of noble metal is precluded for productions over "x" tonnes/y", would be misleading. This implies that no scale of production (kg product/y) precludes the use of noble metals, because if the catalyst is efficient enough, the amount utilized will not be prohibitive.
As an example, we compared methanol and sulfuric acid production. Fig. 2 shows that approximately twice the amount of Cu was consumed to produce less than half the amount of methanol (in tonnes) compared with V consumption for H2SO4 production. However, the lack of direct correlation between production and consumption does not mean that cost is not an important factor in catalyst choice, but is rather correlated with the process revenue.
Having noted that a generalized mass activity does not exist across the investigated processes, we investigated whether a correlation existed between the amount of catalyst consumed and amount of catalytic element mined/produced globally, referred to as the element availability (in kg/y).
Fig. 3 shows the annual consumption of the catalytic and support element for each of the 11 treated reactions versus the availability of that element. The descriptor CCA was introduced here. The elemental consumption for an existing catalytic reaction cannot sustainably exceed the availability, with this limit illustrated as a red line of ratio 1:1 (CCA = 1). As shown, only the non-adopted case of Ru-catalyzed ammonia production was above this line. Notably, for new technologies, the consumption could be imagined to exceed availability, but element production would have to be increased, which would cause prices to increase (this will be treated later). Additional lines corresponding to CCA ratios of 1:10, 1:100, and 1:1, 000 are added to clearly group the catalysts based on consumption. These lines split the figure into three areas: (1) The region around and above-left of the red line (CCA = 1), designated as the unviable region where too much of the element would be used for catalytic purposes and exemplified by non-industrialized Ru-catalyzed ammonia production; (2) the region between orange (CCA = 0.1) and green lines (CCA = 0.001), where most of the catalyst elements fall (surrounding the yellow line of CCA = 0.01), which indicated that it was the viable region. Any catalyst in this region will not be constrained by catalyst consumption; (3) the region to below-right of the green (CCA = 0.001) line, which contains all support and co-catalyst elements (see SI). These elements are used as supports because they are highly abundant and highly affordable, or as co-catalysts of more expensive elements in sufficiently small quantities that do not contribute significantly to the catalyst cost. The Zr/Al catalyst for polypropylene production is also found in this region, but is so efficient (~4×10⁸ turnovers, comparable to ~9.6×10⁸ for Fe-ammonia catalysts [23], see SI) that a purification step to recover/eliminate the catalyst is not worthwhile, so the catalyst is simply inactivated in the final polymer (for comparison, for MeOH the turnover number was estimated at ~4×10⁵). To give a clearer image of these three regions, Fig. 3(B) shows the consumption to availability ratio plotted against the atomic number of the catalytic element. The groupings are now seen as bands colored red, yellow, and green.
Between CCA = 1 and CCA = 0.1 are the three-way catalytic converter elements (automotive), which comprise more than 10% of the annual production of the elements involved. However, as the viability of this process is not directly governed by market forces, but rather by legislation, it is expected that this process could use a larger fraction of the annual production than a "normal" process.
This allows the introduction of a general restriction:
"A viable industrial process will commonly rely on a catalyst that consumes less than ~10% of the primary element production (CCA < 0.1.)."
The only other process having catalyst consumption in this region is the chlor-alkali process, which is well known to use a large fraction of global production of Ru and Ir. This process produces large amounts of products at a low price, yet uses expensive, non-abundant elements. This process can sustain such a high cost of the catalyst due to the higher cost of electricity. In fact, the fraction of electricity cost per product value is 40%. This estimate is based on the average electricity consumption for electrolysis of 2125 kWh/t Cl2 [24], an average price for industrial electricity of US$ 0.099/kWh [25], and a combined product value for Cl2 and NaOH of US$ 521/t Cl2 produced [26]. Therefore, a majority of the cost of Cl2 production is the electricity cost, which goes up significantly if a less active catalyst is used. Accordingly, a high-cost catalyst is preferable to an increase in electricity costs due to using a cheaper, less efficient catalyst. This led to an investigation into whether a correlation exists between catalyst cost and product value. Fig. 4(A) shows the correlation between cost of catalyst consumed per kg of product generated and the product value. The slope of this line corresponds to the catalyst cost divided by the product value. Fig. 4(B) shows the aforementioned ratio plotted against atomic number, which is is the previously introduced CCP ratio. Fig. 4(A) shows lines for CCP ratios of 1, 0.1, 0.01, and 0.001. Only the non-industrial Ru-catalyzed ammonia, chlor-alkali, and high-pressure HNO3 processes were present in the region of CCP > 0.01 showing that almost all investigated industrial processes use less than 1% of product revenue to pay for the catalyst.
These results allow a second restriction to be introduced:
"A viable industrial process should rely on a catalyst that costs less than ~1% of the product price (CCP < 0.01)."
This constraint arises because for a process with CCP > 0.01, the cost of consumed catalyst poses too large a fraction of the price of the product, making the process too sensitive to fluctuations in active element price. Notably, the high-pressure HNO3 process has fallen out of favor in new plants due to the high cost of the consumed catalyst, which further supports that this process is less viable than the dual-pressure process, as indicated in Fig. 4. A spreadsheet for estimating CCA and CCP is included in the SI.
3.5 Application of framework to literature or dream reactions
Several reactions are considered "dream" reactions, meaning that the development of catalytic processes for these reactions would revolutionize the catalytic industry.
These reactions include (but are not limited to) low temperature and pressure ammonia production, methane to methanol conversion via partial oxidation, heterogeneous hydrogen peroxide production, direct nitric acid production from N2, photocatalytic fuel production (including water splitting), direct electrolytic CO2 reduction, heterogeneous asymmetric reactions, and the synthesis of liquid fuels directly from a renewable feedstock.
If a catalyst were developed for one of these reactions, properties such as optimal efficiency, loading, and lifetime would likely be more or less unknown. However, it would still be important to estimate the potential of such a new catalyst. Below, we demonstrate how our method may allow for preliminary estimates of viability using data from existing processes.
To illustrate how to apply the above restrictions predictively, we shall treat a literature example, the case of NiGa as a catalyst for methanol (MeOH) production from CO2, as published in Nature in 2014 [27]. This prediction procedure requires the scale of production (kg/y), activity (kg product/kg catalyst), and lifetime to be known, or estimated from a known process, to calculate the catalyst consumption rate. To this end, we compared the catalyst consumption rate for the two HNO3 processes (Fig. 2). The catalyst consumption rate was different for the two processes, but fell within ±0.87 times the average. However, this span would have only a relatively small influence on the average consumption on the logarithmic axis used in Fig. 5. The same trend was seen for the two ammonia processes treated here.
 |
(1) |
 |
(2) |
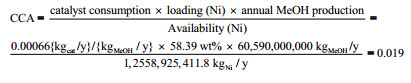
Therefore, this approach allows tentative comparison across various catalysts within a given process (product). In the following example, we use the commercial MeOH production process to estimate key parameters for its NiGa catalyst. The Ni5Ga3 catalyst demonstrates excellent MeOH activity, with the authors suggesting it as a potential catalyst for decentralized MeOH production from renewable energy. Therefore, decentralized MeOH could become a renewable fuel of the future. As it can be produced on-site, the need for fuel transportation over long distances would be eliminated. From the literature report [27], we inferred a peak MeOH production rate of 0.233 mol MeOH/mol active metal/h for Ni5Ga3. Notably, Ga is predicted to be part of the active site on Ni5Ga3 for MeOH synthesis. As the catalyst lifetime is unknown under industrial conditions, we initially assumed a 3.5-y lifetime, which is similar to that of the current methanol catalyst [28]. This would probably be a lower bound, as the initial catalyst activity is reported to be completely regenerable, unlike that of the currently used Cu/ZnO/Al2O3 catalyst. As the production of MeOH (kg/y) when used as a renewable fuel cannot be readily estimated, we used the current annual production of MeOH, which was 60.6 billion kg in 2012 [29]. As a result, with an annual catalyst consumption of 0.00066 (kg cat./y)/(kg MeOH/y), the CCA ratio was 0.019 (Eq. (1)) for Ni and 132 for Ga.
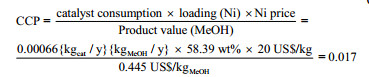
Using the Ni price of US$ 20/kg Ni [2] and MeOH price of US$ 0.445/kg MeOH from 2006 [26], the CCP ratios were 0.017 for Ni (Eq. (2)) and 0.49 for Ga (US$ 794/kg [2]).
The CCA ratio for Ni (CCA = 0.019) was below the 0.1 guideline introduced above, meaning that using Ni for MeOH production is predicted to be viable. However, Ga use (CCA = 132) was approximately three orders of magnitude larger than current production can viably support according to the above principle. Accordingly, Ga production would have to increase very significantly to meet this demand. As Ga is not mined as a pure ore, but rather as a side-product of other ores [2], increasing its production would require a large capital investment and, consequently, increase the price of Ga significantly, similarly to the Rh example given earlier. Notably, the catalyst lifetime was set to 3.5 y and MeOH production was set to ~6×10¹⁰ kg/y. Therefore, implementation could easily become viable if the catalyst is used on a delocalized smaller scale.
As the CCP ratio for Ni (CCP = 0.017) was close to the 0.01 limit, a lifetime of above 3.5 y would make the use of Ni borderline economically viable. However, the CCP ratio for Ga (CCP = 0.49) was 49 times larger than the 0.01 limit, again showing that the efficiency would need to be increased significantly to avoid Ga use becoming an economic constraint of large scale production. Therefore, the current price of MeOH cannot support the significant increase in the Ga price that would arise from the necessary increase in mining.
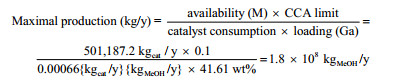
As indicated above, the Ni-Ga MeOH catalyst is proposed for low pressure, small-scale units located directly where the renewable energy is formed. This means that implementation would likely not be on the same scale as current MeOH production. Using the above guideline for Ga consumption (CCA < 0.1), the maximal production scale can be estimated from the current Ga availability, with the conservative estimate affording ~5×10⁷ kg MeOH/y using this catalyst.
Although it has not been possible to extract a generalized mass activity across the 11 reactions investigated here, it was found that, given the activity and loading of a catalyst, all industrial processes can be grouped according to CCA and CCP ratios. We propose that these constraints can be used as a rough prediction of elements that would be neither too scarce nor too expensive to realistically substitute Ga in Ni5Ga3, assuming that the activity is not changed significantly (i.e., barring a "super-catalyst" with orders of magnitude larger activity) using a scarce element. We therefore extrapolated the analysis of CCA and CCP ratios (Eq. 3(a) and 3(b), where M indicates each treated element (exemplified here by In)) to the rest of the periodic table, for which production and price data were available (calculation spreadsheet is included in the SI).
 |
(3a) |
 |
(3b) |
Eqs. 3(a) and 3(b) show that replacing Ga with In (the next element down in group 13) would also not be viable. By expanding to other elements, Fig. 5 is generated (using the SI spreadsheet). Notably, according to these predictions, MeOH production is viable for elements with both CCA and CCP ratios in the green region or above, as indicated in green in Fig. 5. Elements for which only one indicator (CCA/CCP) was viable are marked in both green and red. First row transition elements are all viable or borderline viable, as well as Sn and Sb. It should be emphasized that this prediction is a rough estimate (as indicated by the gradient transition from viable to unviable) of which elements are likely substitutes, while assuming the activity of the Ni5Ga3 is maintained post-substitution and that the relevant scale of production is ~6×10¹⁰ kg/y (current MeOH production).
The spreadsheet used to calculate the maximal viable product price and scale of production for each element in the periodic table for which availability and element prices could be obtained is shown in the SI.
The following limitations were identified in our method, but not explicitly treated: (1) Diverting element resources away from existing processes to support new processes; (2) geopolitics of localized strategic ores, such as the current discussion of rare earth metal production [30]; (3) toxicity of elements, such as Pb, Cd, and Tl; and (4) opening new mines that might lower prices on a timescale of several years. It is inherently difficult to estimate the ability to expand the current amount of mined ore to meet new demands, but this would undoubtedly be associated with an increased price and significant lag time. Some elements are even by-products of other more valuable elements. Therefore, increasing extraction of both elements (without necessary demand for the latter) would decrease the value of the excess component and overall profits until the minor component attained a higher price than the major component.
In this work, we have investigated 11 industrial catalytic reactions and their corresponding consumption of around 37 elements. By comparing the active catalyst element consumption with the global element production, we identified the correlation that most industrially applied catalytic reactions rely on elements with CCA ratios of between ~10–1 and ~10–3. Some reactions fell outside of this range, which was used to designate three regions as "unviable", "viable", or "highly viable", respectively. It was concluded that the consumption to production ratio of 0.1 was exceeded due to either the absence of alternative catalysts or the legislative demand to employ these catalysts, as exemplified by automotive exhaust cleaning catalysts based on Pt, Pd, and Rh. In contrast, the consumption of Zr and Al in Ziegler-Natta catalysts is so low that the ratio falls far below 10–3, in agreement with the catalyst being cost-effective enough to make leaving it in the final product economical.
A similar relationship was also observed for the consumed catalyst cost relative to the product value. This allowed us to define the CCP ratio. At values higher than ~10–2, this ratio is associated with unviable processes, such as those only driven by legislation, while at values lower than ~10–4, the catalyst cost is deemed inconsequential. The outliers of these limits are the same as for the CCA ratio. This allowed us to group existing reactions, but also predict the viability of a new catalyst for an existing product. We illustrated this approach by evaluating the Ni3Ga5 catalyst for MeOH production using estimates for production scale and catalyst lifetime from the existing Cu-based process. We concluded that, for Ni3Ga5, current MeOH production was too large-scale to be supported by the current availability of Ga (CCA ≈ 132 > > 0.1) and that the Ga price was also prohibitive, at 49% (CCP ≈ 0.49 > > 0.01) of the current product price. We solved equations for CCA and CCP for the product scale and product price, respectively, to predict that 1.8×10⁸ kg MeOH/y or US$ 22/kg MeOH were the approximate limits for this catalyst at current MeOH production metrics. Therefore, if MeOH production was less than ~1×10⁸ kg MeOH/y, Ga production would likely not be a restriction. We also showed that the CCA and CCP ratio limits could be used to predict which elements other than Ga could be investigated for substitution (providing no loss in efficiency). While primary production elements, such as Cu, may be somewhat scaled to demand, elements such as Ga (a coproduct of Al production) are less scalable. The predictions suggested in this work offer a second-generation approximation of viability, but alone do not provide a sufficient determination of viability for industrial implementation.
The guidelines presented here could be a powerful tool to allow researchers to make second-generation quantitative predictions of whether a studied catalyst could be applied industrially, and inspire their research into alternative, and possibly more viable, elements for testing using only a few easily obtainable parameters.
Acknowledgments
We would like to acknowledge support from the Villum Foundation V-SUSTAIN grant 9455 to the Villum Center for the Science of Sustainable Fuels and Chemicals.
 2018,
Vol. 39
2018,
Vol. 39  PDF
PDF