“I love the lab” research training: a cationic covalent organic framework aerogel for organic dye removal
LI Yunmeng#, LI Hongyi#, CAO Dongxiao, TANG Anna*(), KONG Deming
Research Center for Analytical Sciences,Tianjin Key Laboratory of Biosensing and Molecular Recognition,National Demonstration Center for Experimental Chemistry Education,College of Chemistry,Nankai University,Tianjin 300071,China
LI Yunmeng, LI Hongyi, CAO Dongxiao, TANG Anna, KONG Deming. “I love the lab” research training: a cationic covalent organic framework aerogel for organic dye removal[J]. Chinese Journal of Chromatography, 2026, 44(7): 812-820.
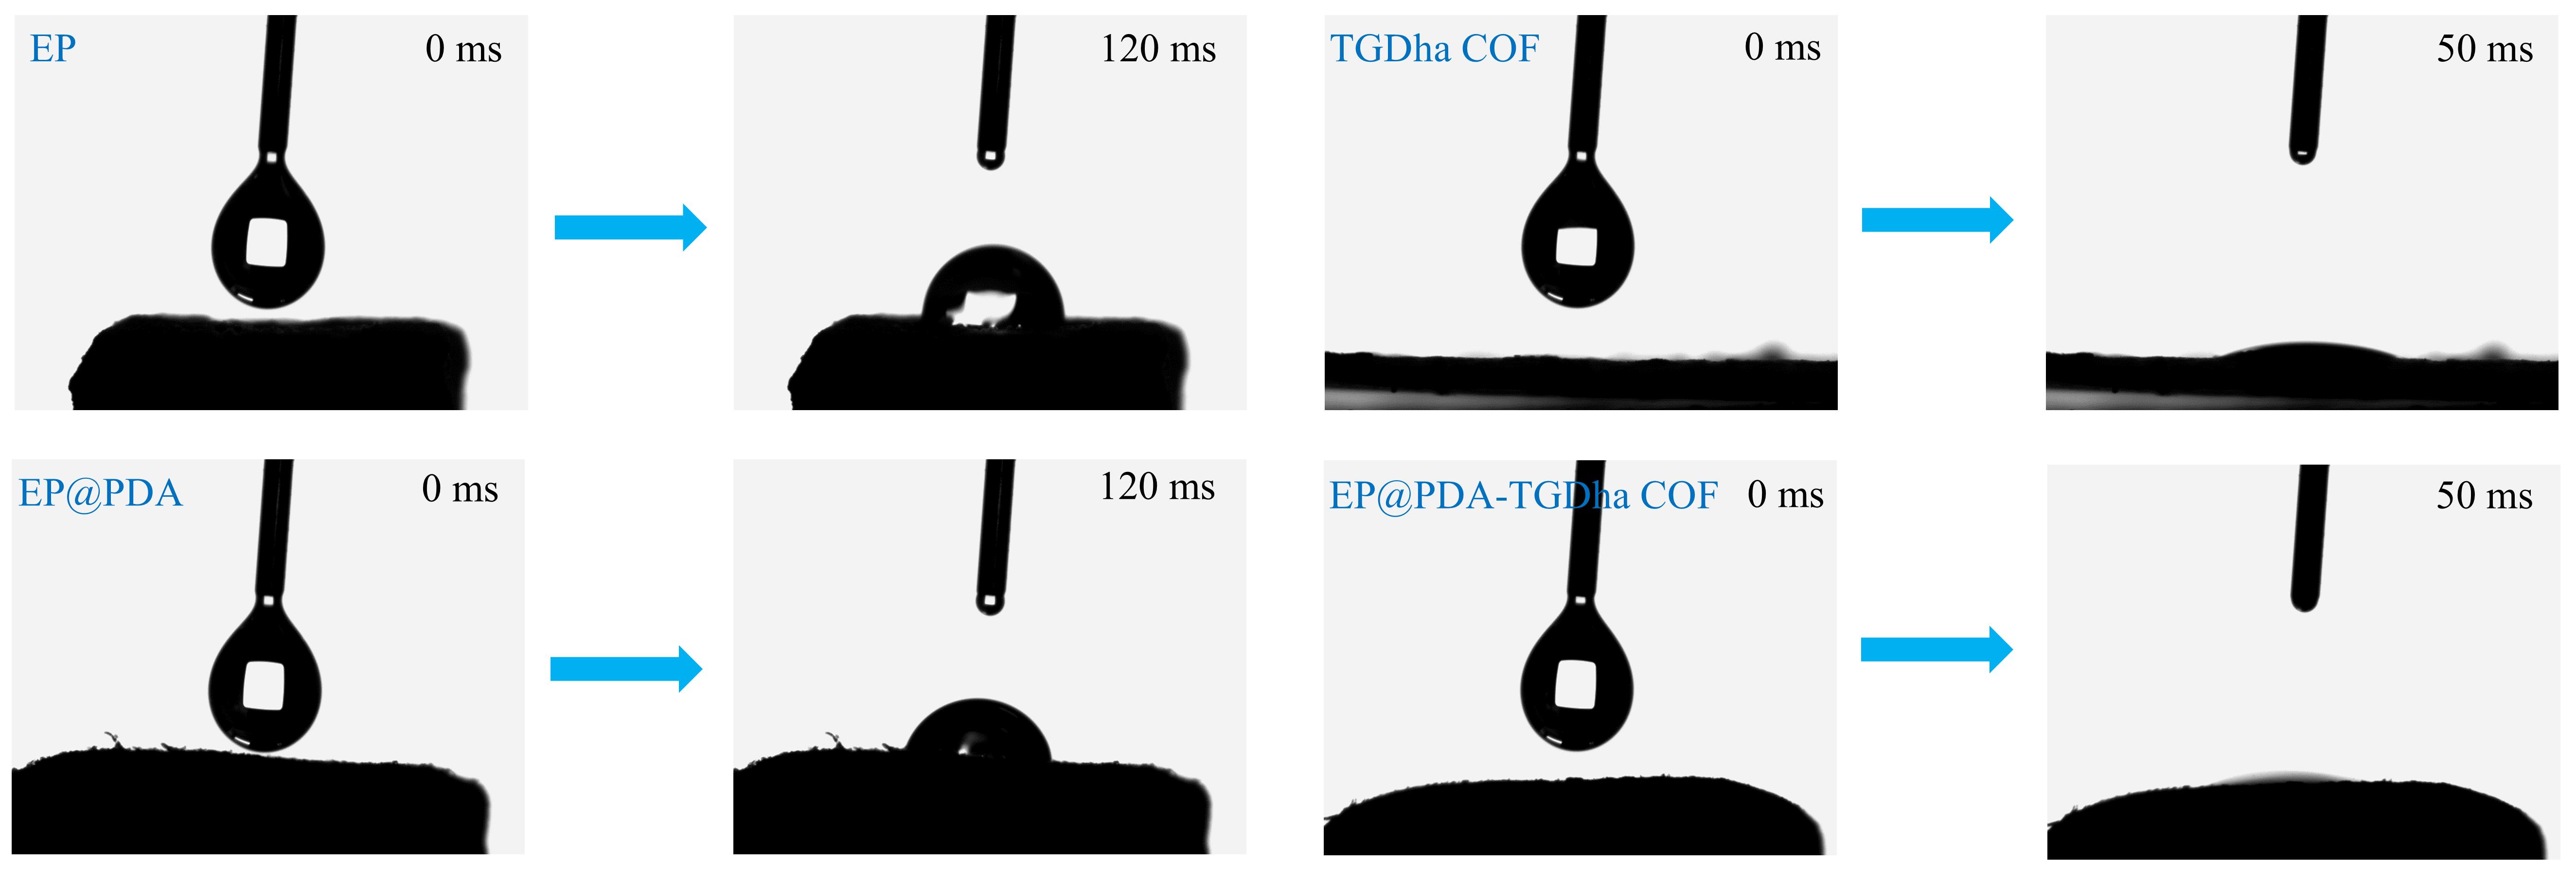
Fig. 4 Contact angles of water of EP, EP@PDA, TGDha COF, EP@PDA-TGDha COF at room temperature
Fig. 4 Contact angles of water of EP, EP@PDA, TGDha COF, EP@PDA-TGDha COF at room temperature
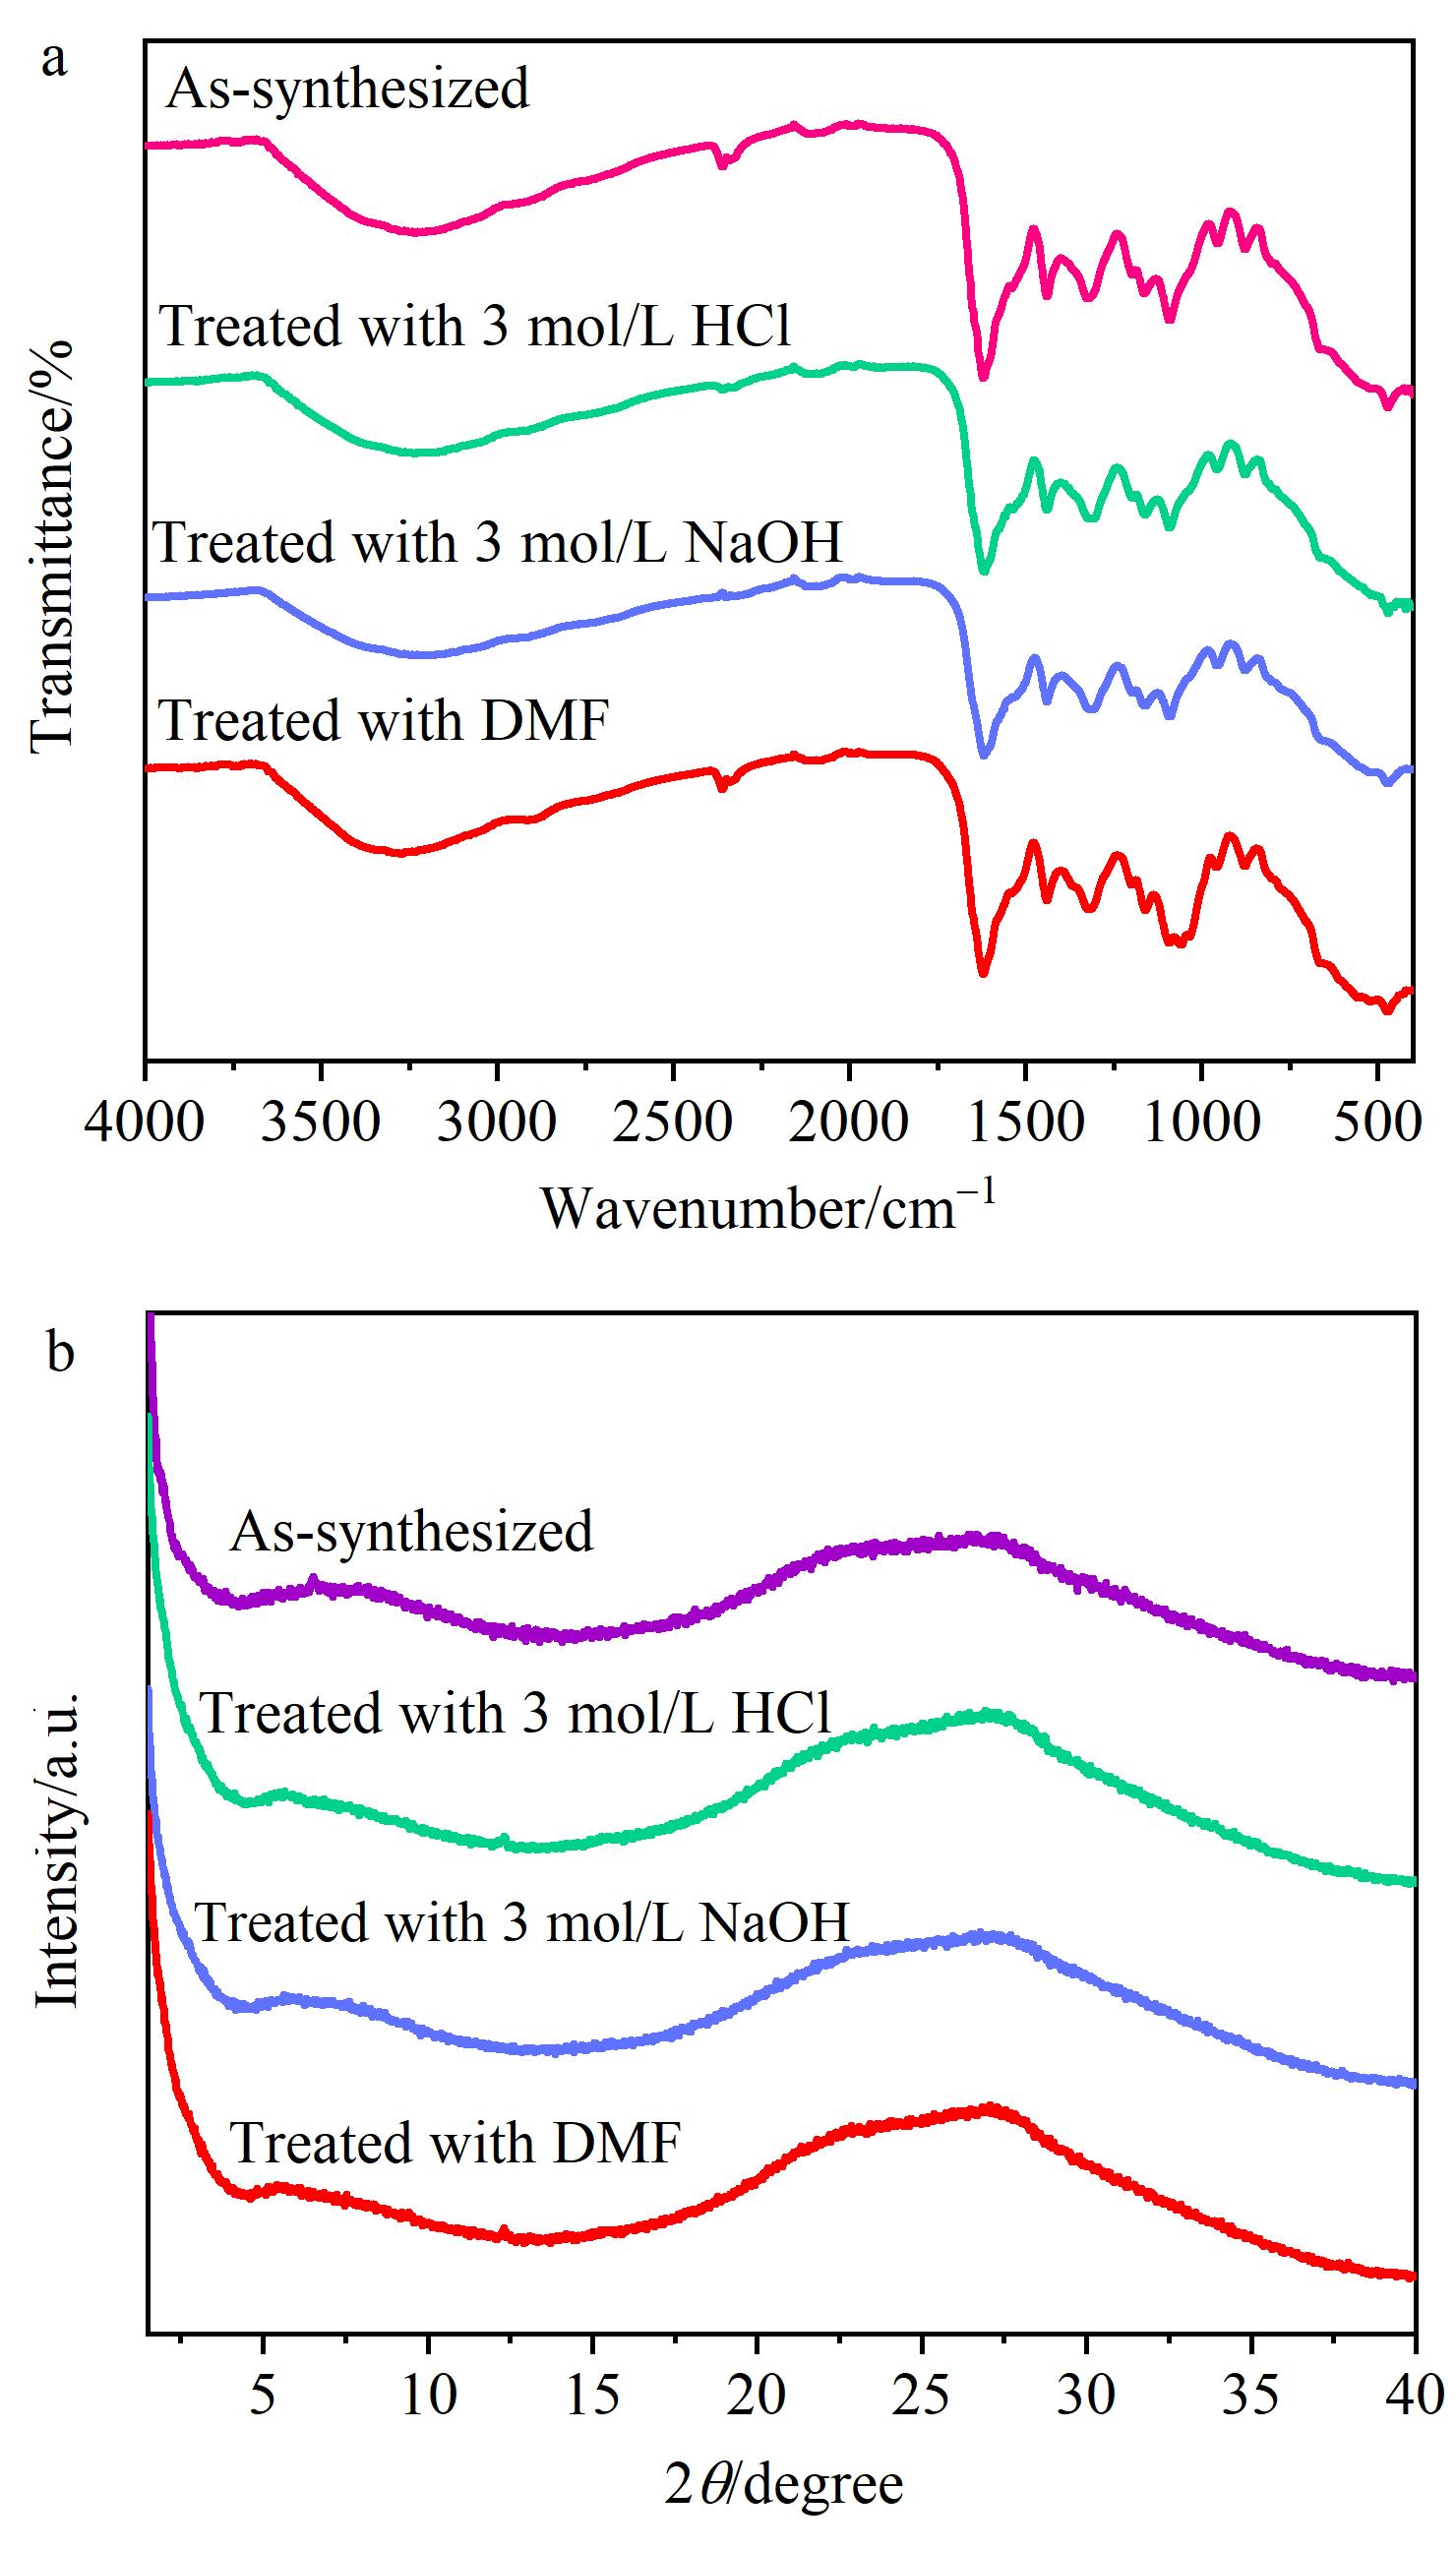
Fig. 5 (a) Infrared spectra and (b) PXRD patterns of the untreated EP@PDA-TGDha COF and the EP@PDA-TGDha COF soaked in HCl, NaOH and N,N-dimethylformamide (DMF) for three days, respectively
Fig. 5 (a) Infrared spectra and (b) PXRD patterns of the untreated EP@PDA-TGDha COF and the EP@PDA-TGDha COF soaked in HCl, NaOH and N,N-dimethylformamide (DMF) for three days, respectively
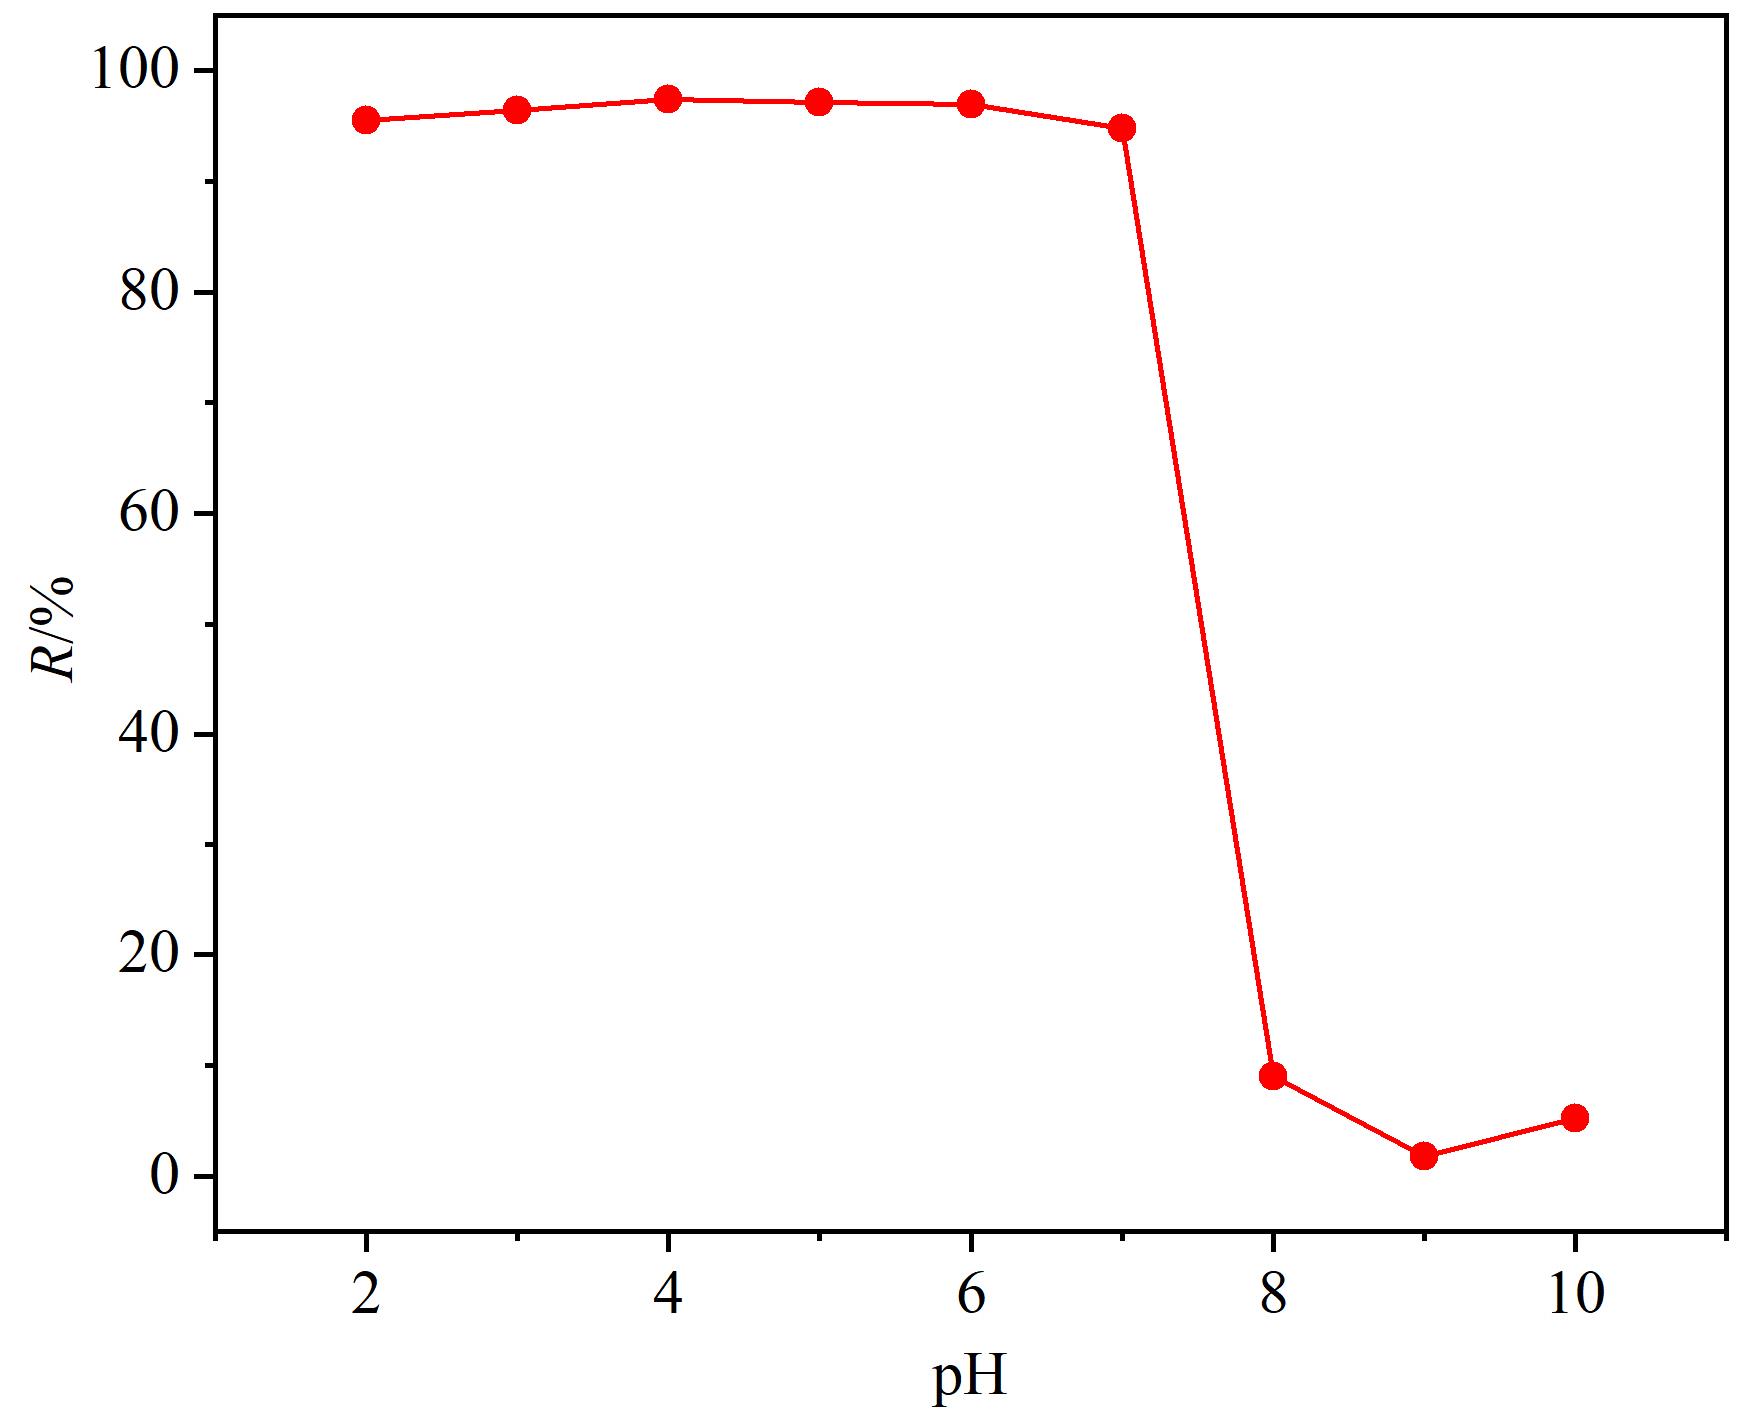
Fig. 6 Rremoval rates of methyl orange (MO) with EP@PDA-TGDha COF under different pH conditions
Fig. 6 Rremoval rates of methyl orange (MO) with EP@PDA-TGDha COF under different pH conditions
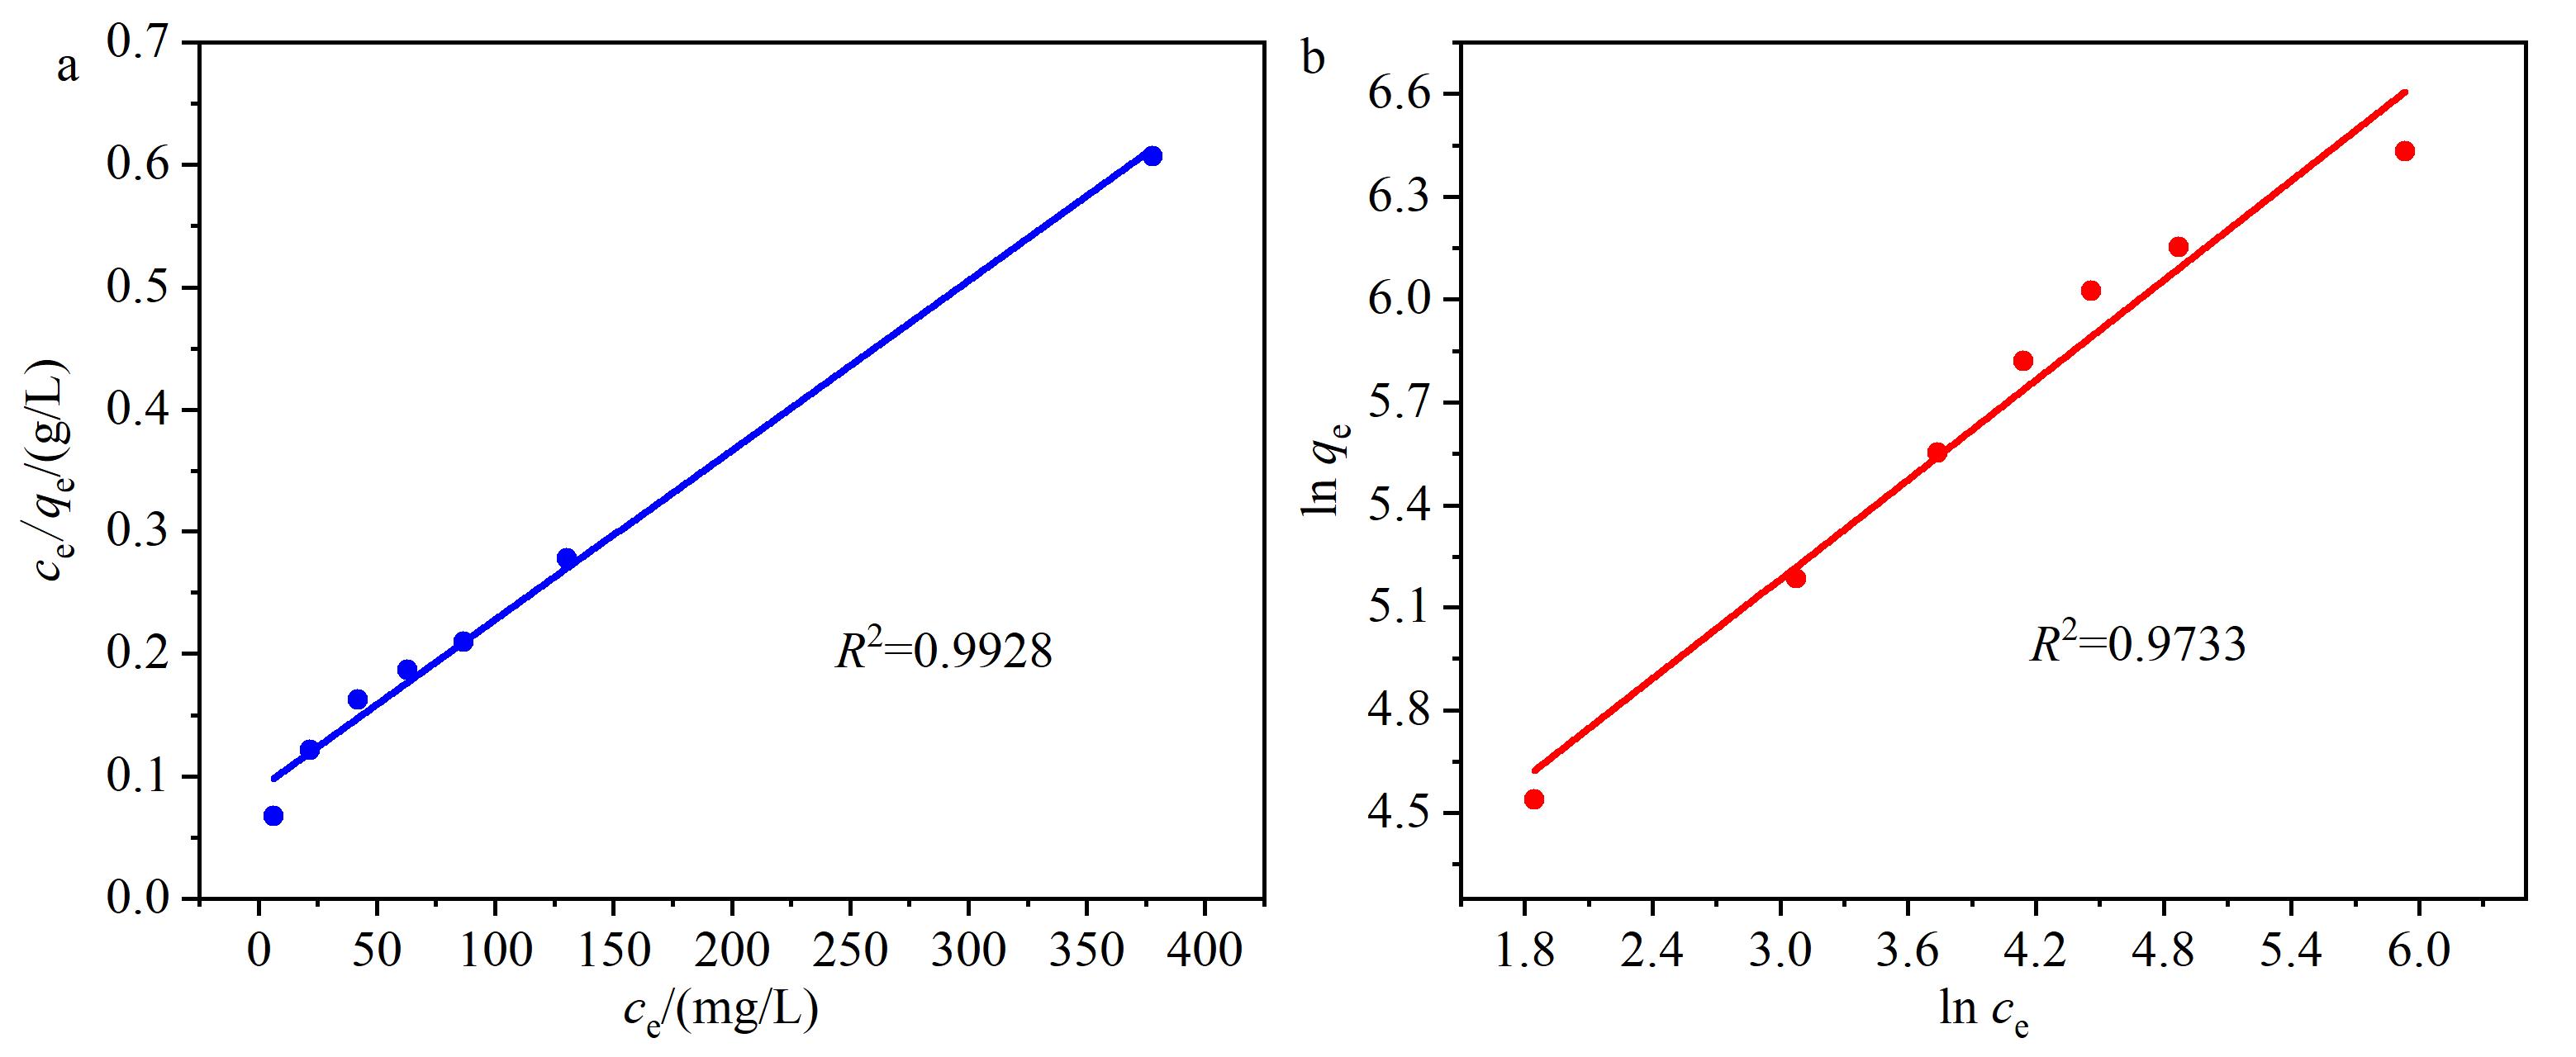
Fig. 7 (a) Langmuir and (b) Freundlich isotherm adsorption models
Fig. 7 (a) Langmuir and (b) Freundlich isotherm adsorption models
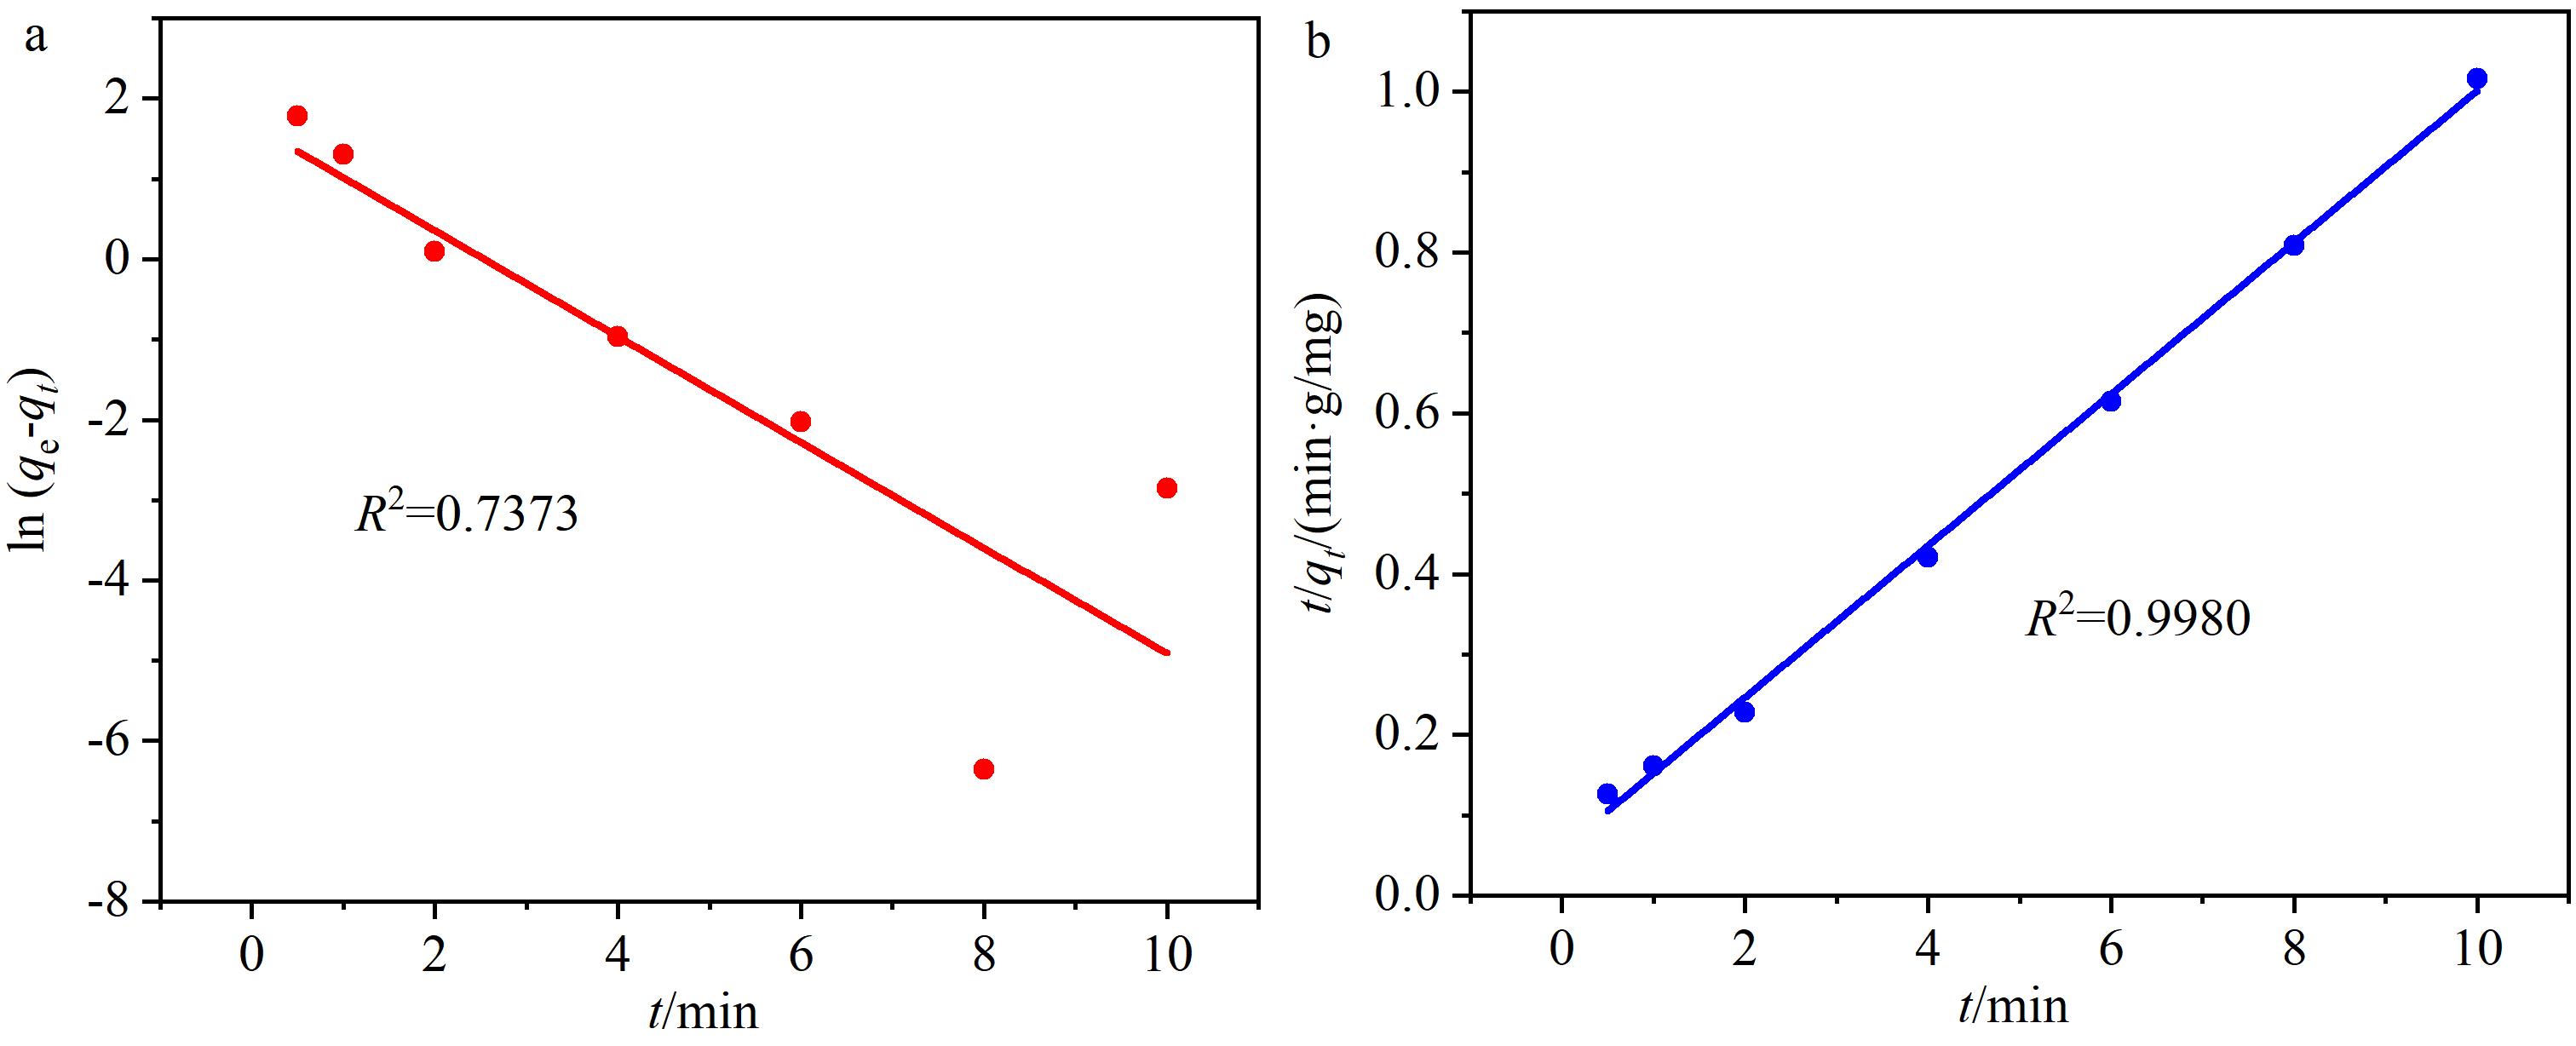
Fig. 8 (a) Pseudo-first-order and (b) pseudo-second-order kinetic models of the adsorption process of MO by EP@PDA-TGDha COF
Fig. 8 (a) Pseudo-first-order and (b) pseudo-second-order kinetic models of the adsorption process of MO by EP@PDA-TGDha COF
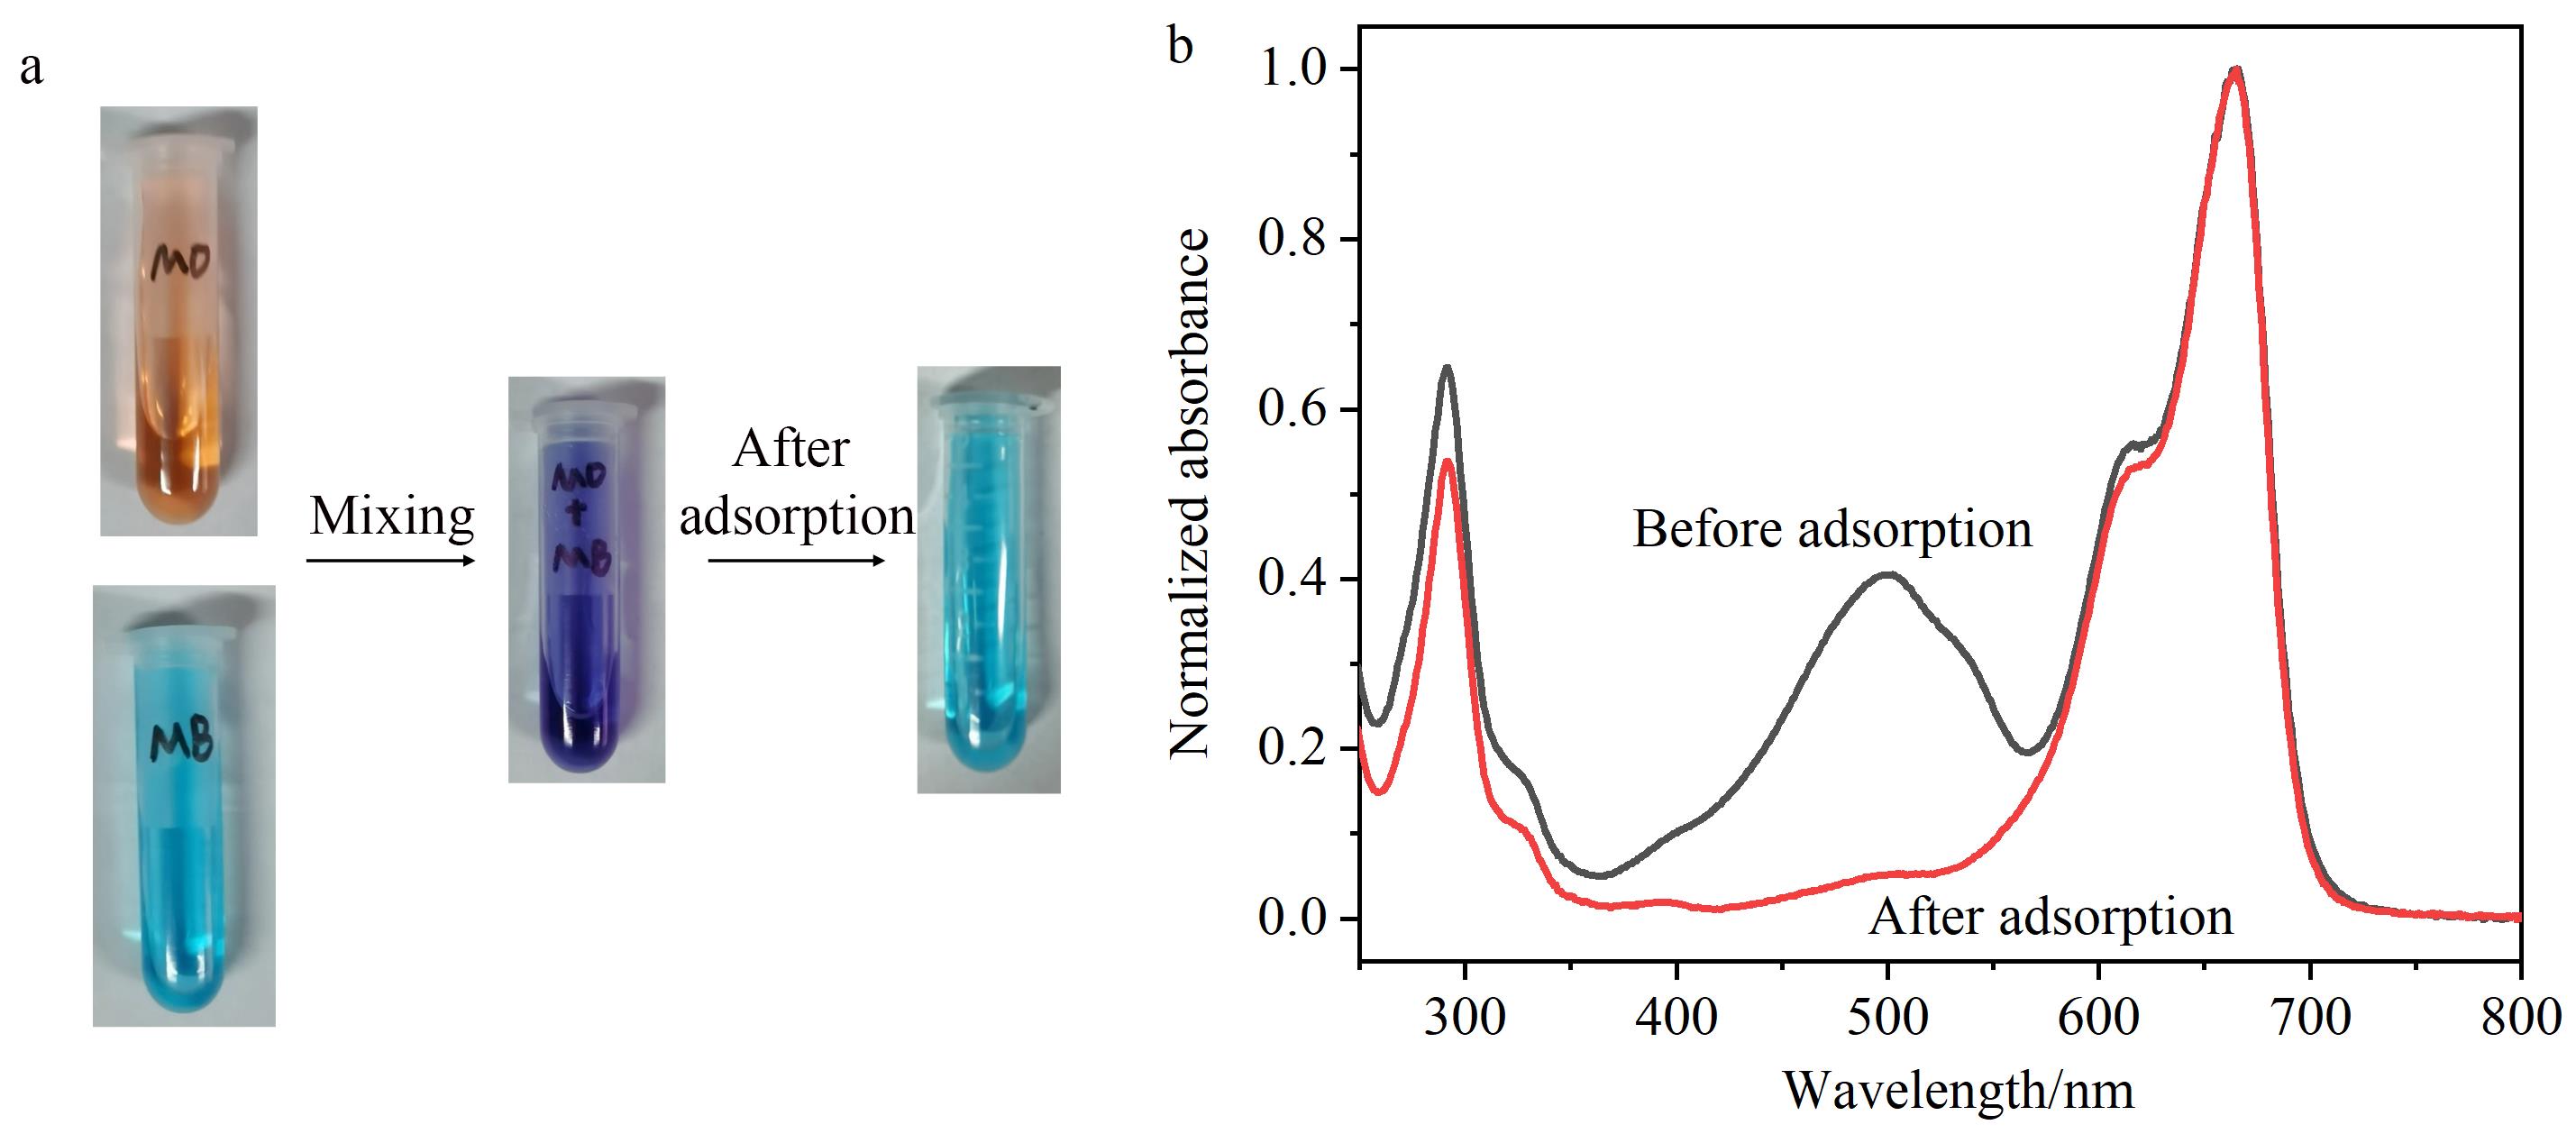
Fig. 9 (a) Selective adsorption of MO and methylene blue (MB) mixed solution by EP@PDA-TGDha COF and (b) their UV visible absorption spectra before and after adsorption
Fig. 9 (a) Selective adsorption of MO and methylene blue (MB) mixed solution by EP@PDA-TGDha COF and (b) their UV visible absorption spectra before and after adsorption
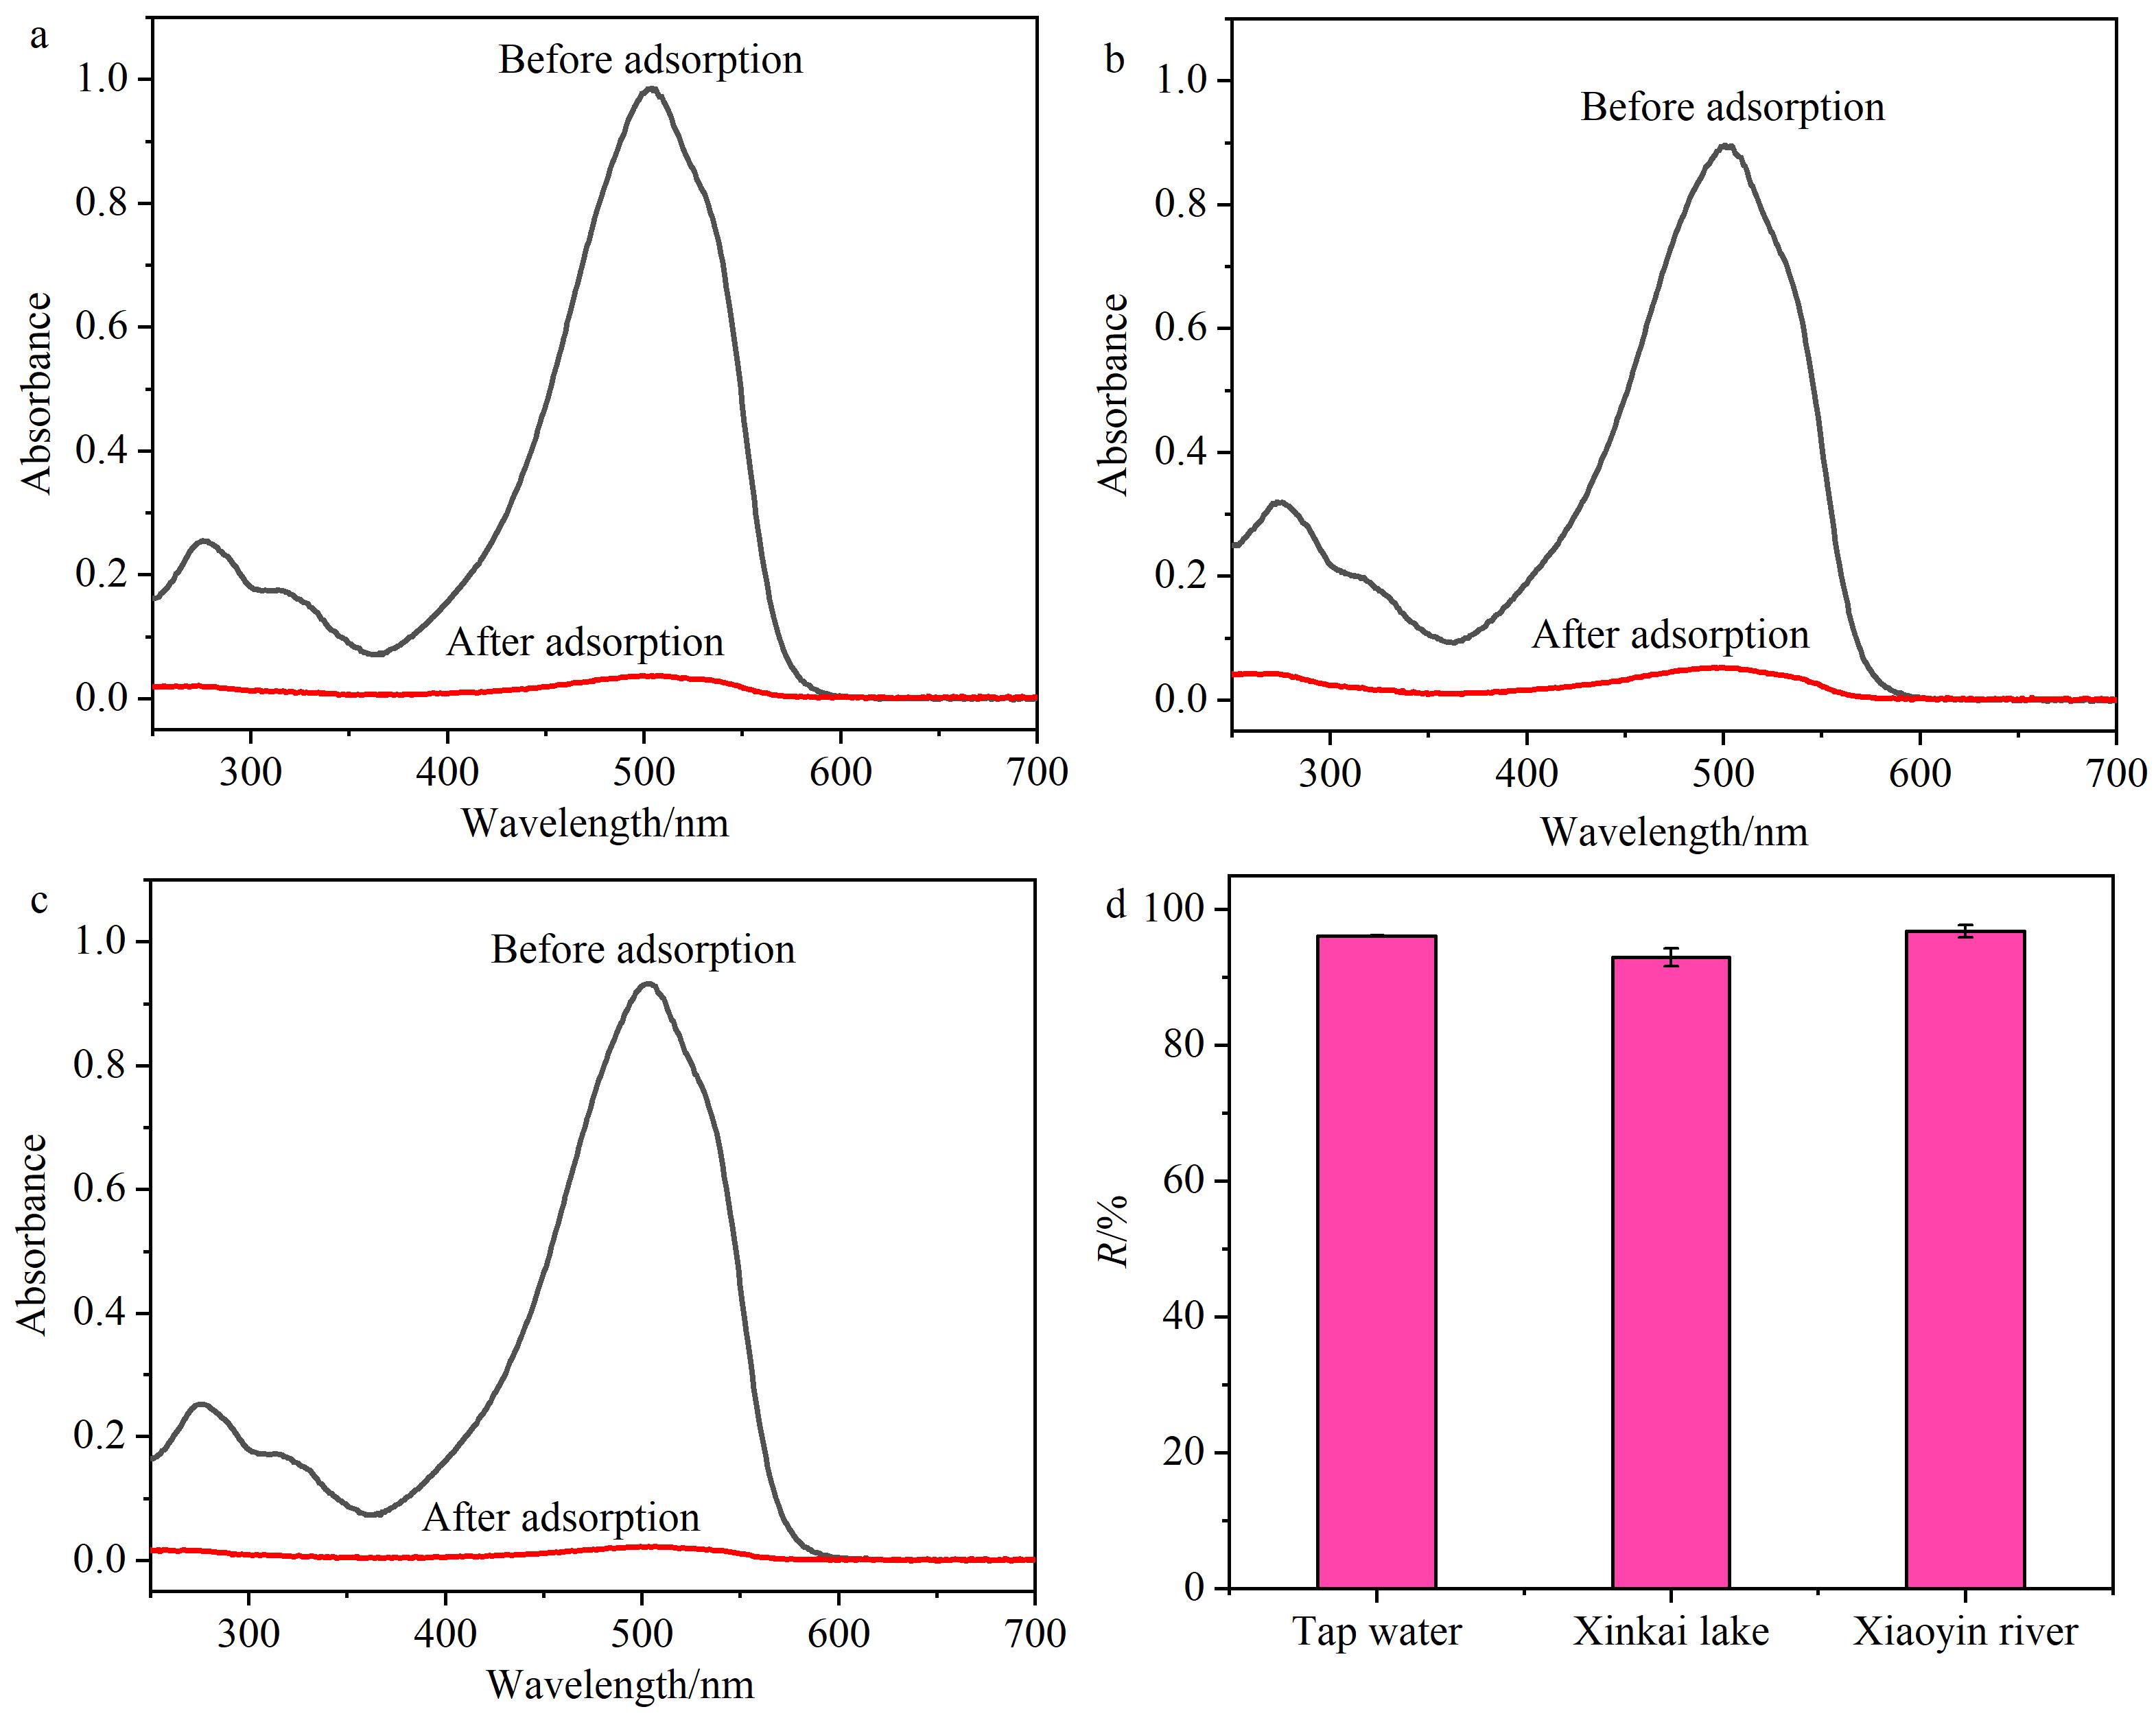
Fig. 10 UV visible absorption spectra of actual spiked water samples from (a) tap water, (b) Xinkai lake and (c) Xiaoyin river before and after adsorption; (d) removal rates of MO with EP@PDA-TGDha COF in different actual water samples (n=3)
Fig. 10 UV visible absorption spectra of actual spiked water samples from (a) tap water, (b) Xinkai lake and (c) Xiaoyin river before and after adsorption; (d) removal rates of MO with EP@PDA-TGDha COF in different actual water samples (n=3)

 ), KONG Deming