
Chinese Journal of Chromatography ›› 2026, Vol. 44 ›› Issue (9): 1059-1073.DOI: 10.3724/SP.J.1123.2026.03027
• Instrument Development and Applications • Previous Articles Next Articles
CHEN Junbin1,2, CAI Haoyuan1,*( ), DENG Zhihan1,2, JIN Yujie1,2, SUN Jianhai1
Received:2026-03-30
Online:2026-09-08
Published:2026-09-17
Supported by:CLC Number:
CHEN Junbin, CAI Haoyuan, DENG Zhihan, JIN Yujie, SUN Jianhai. Development and performance testing of a high-sensitivity pulsed flame photometric detector[J]. Chinese Journal of Chromatography, 2026, 44(9): 1059-1073.
Add to citation manager EndNote|Ris|BibTeX
URL: https://www.chrom-china.com/EN/10.3724/SP.J.1123.2026.03027
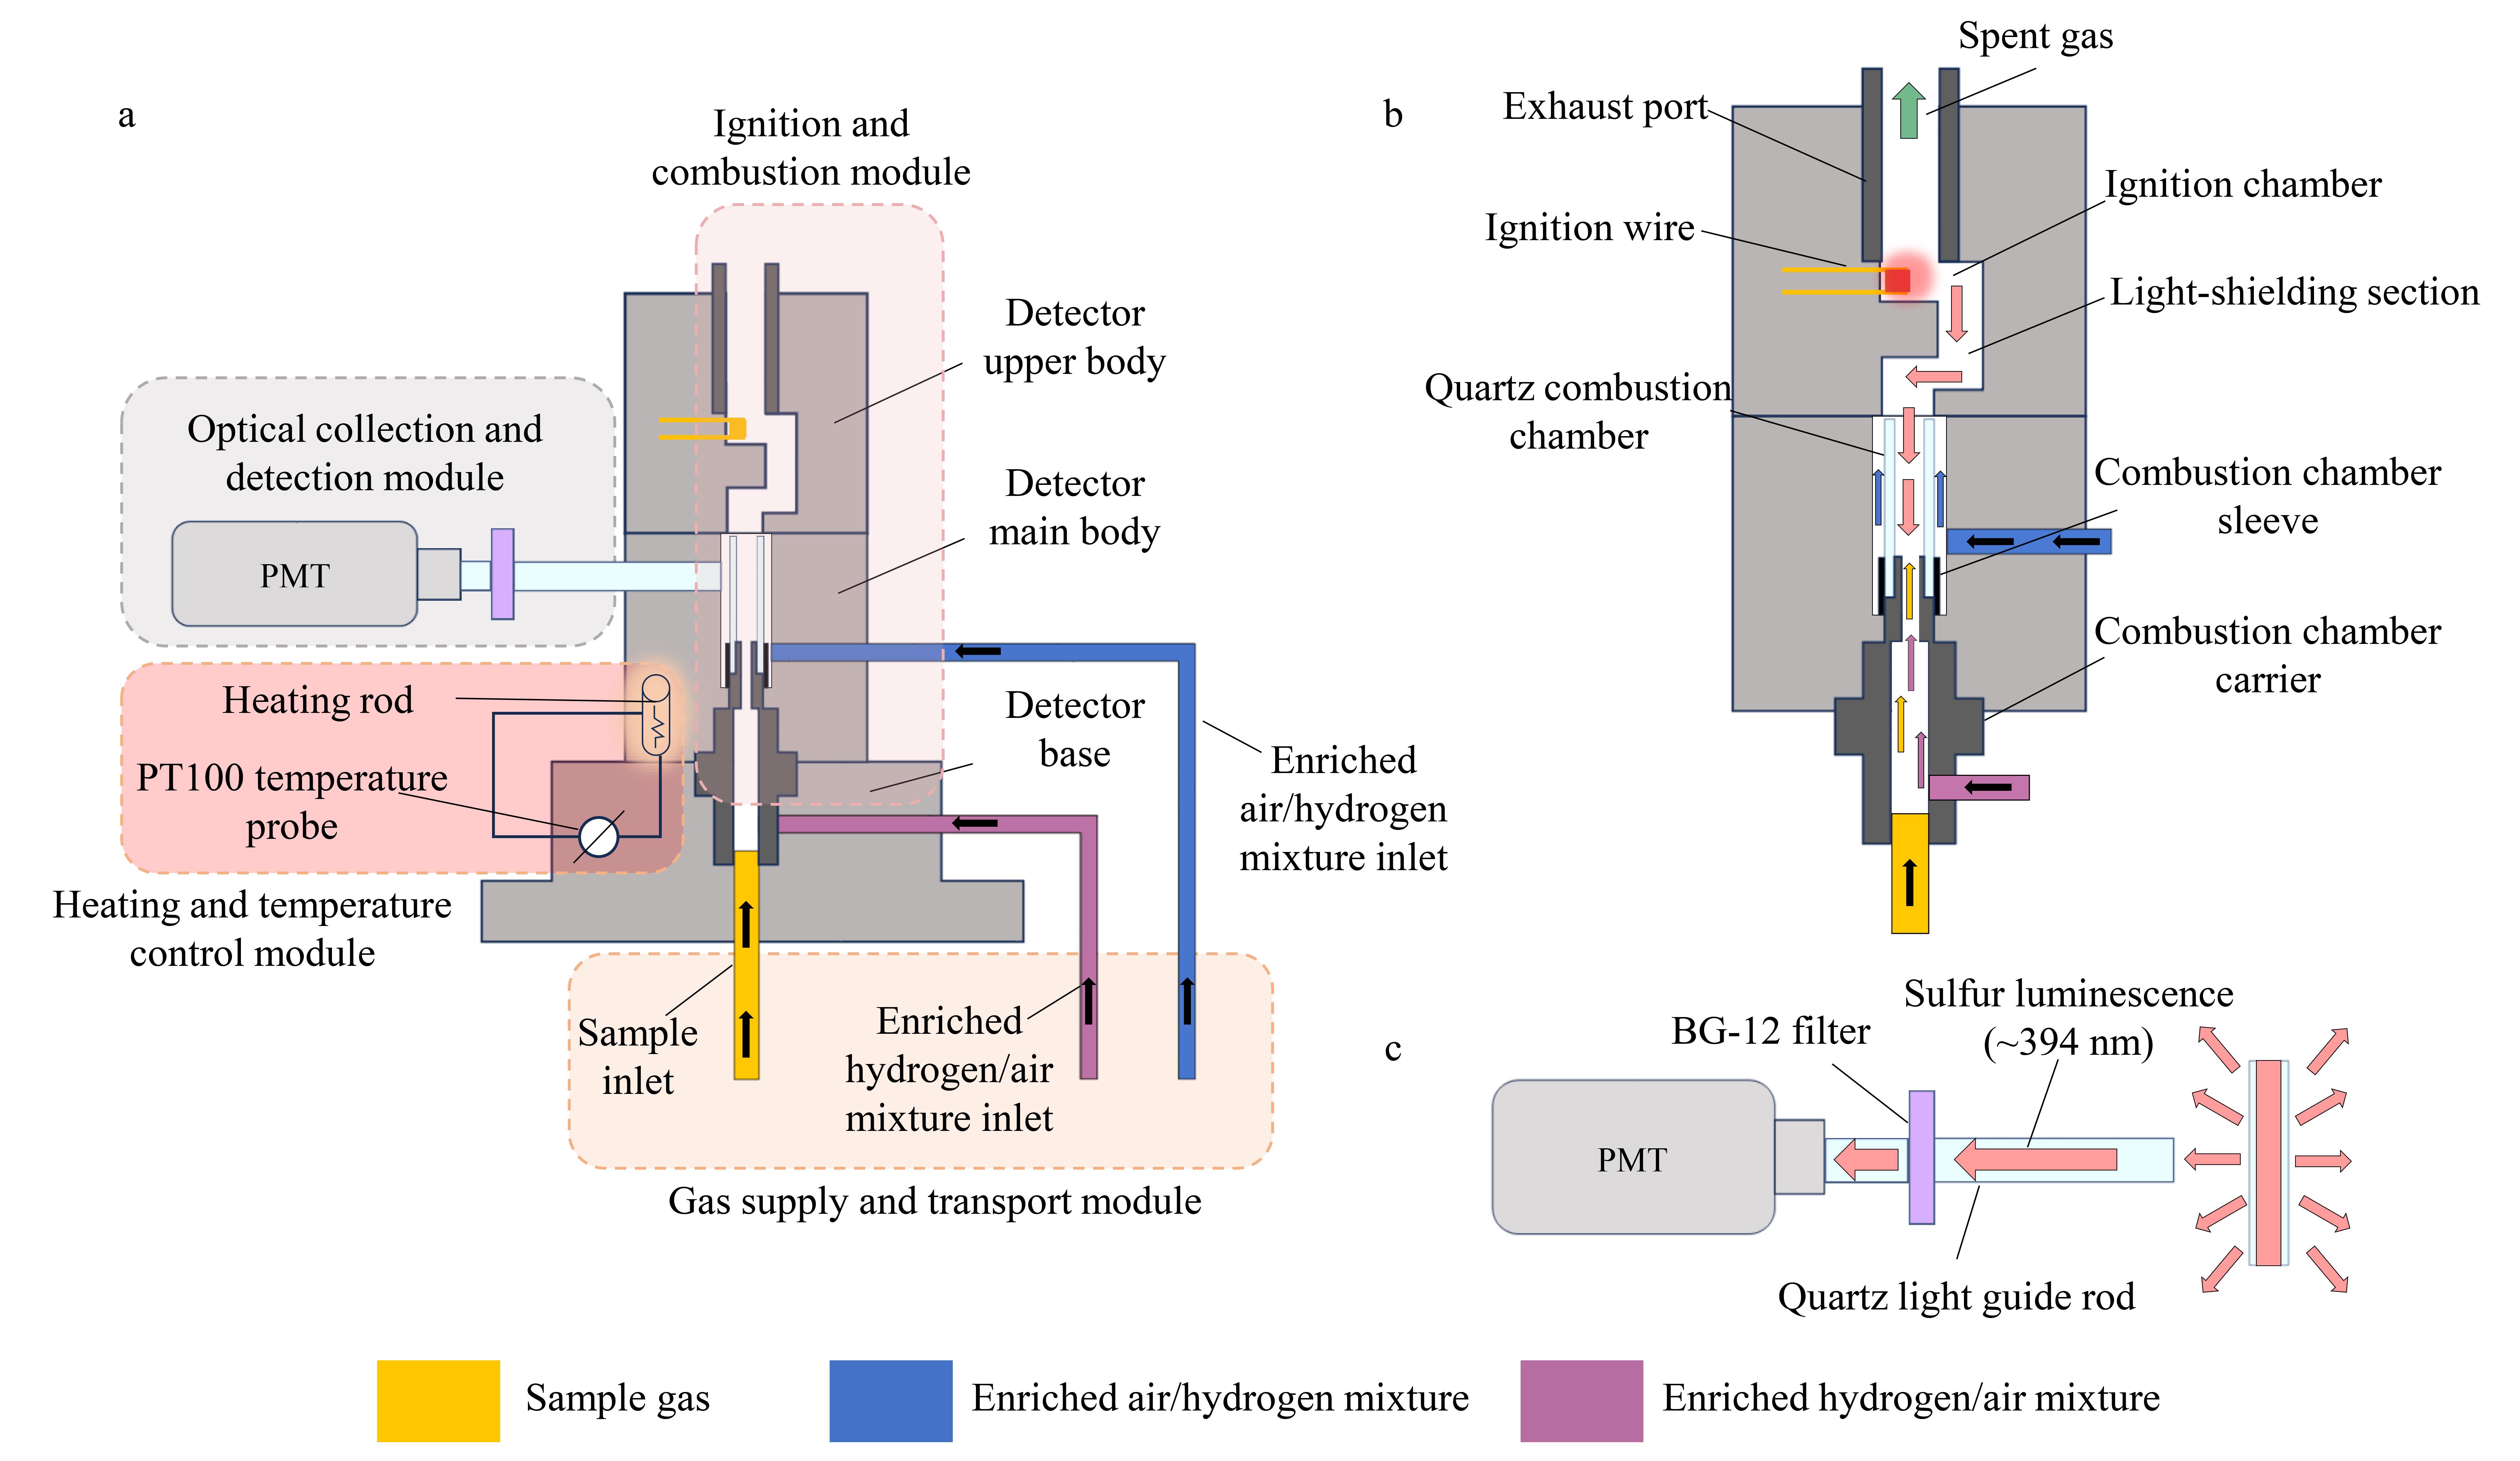
Fig. 1 Structural configuration of the PFPD and schematic illustrations of its flame-propagation process and optical detection patha. overall structure of the detector and division of functional modules; b. schematic illustration of the flame propagation path; c. schematic illustration of the optical detection path.PFPD: pulsed flame photometric detector; PMT: photomultiplier tube.
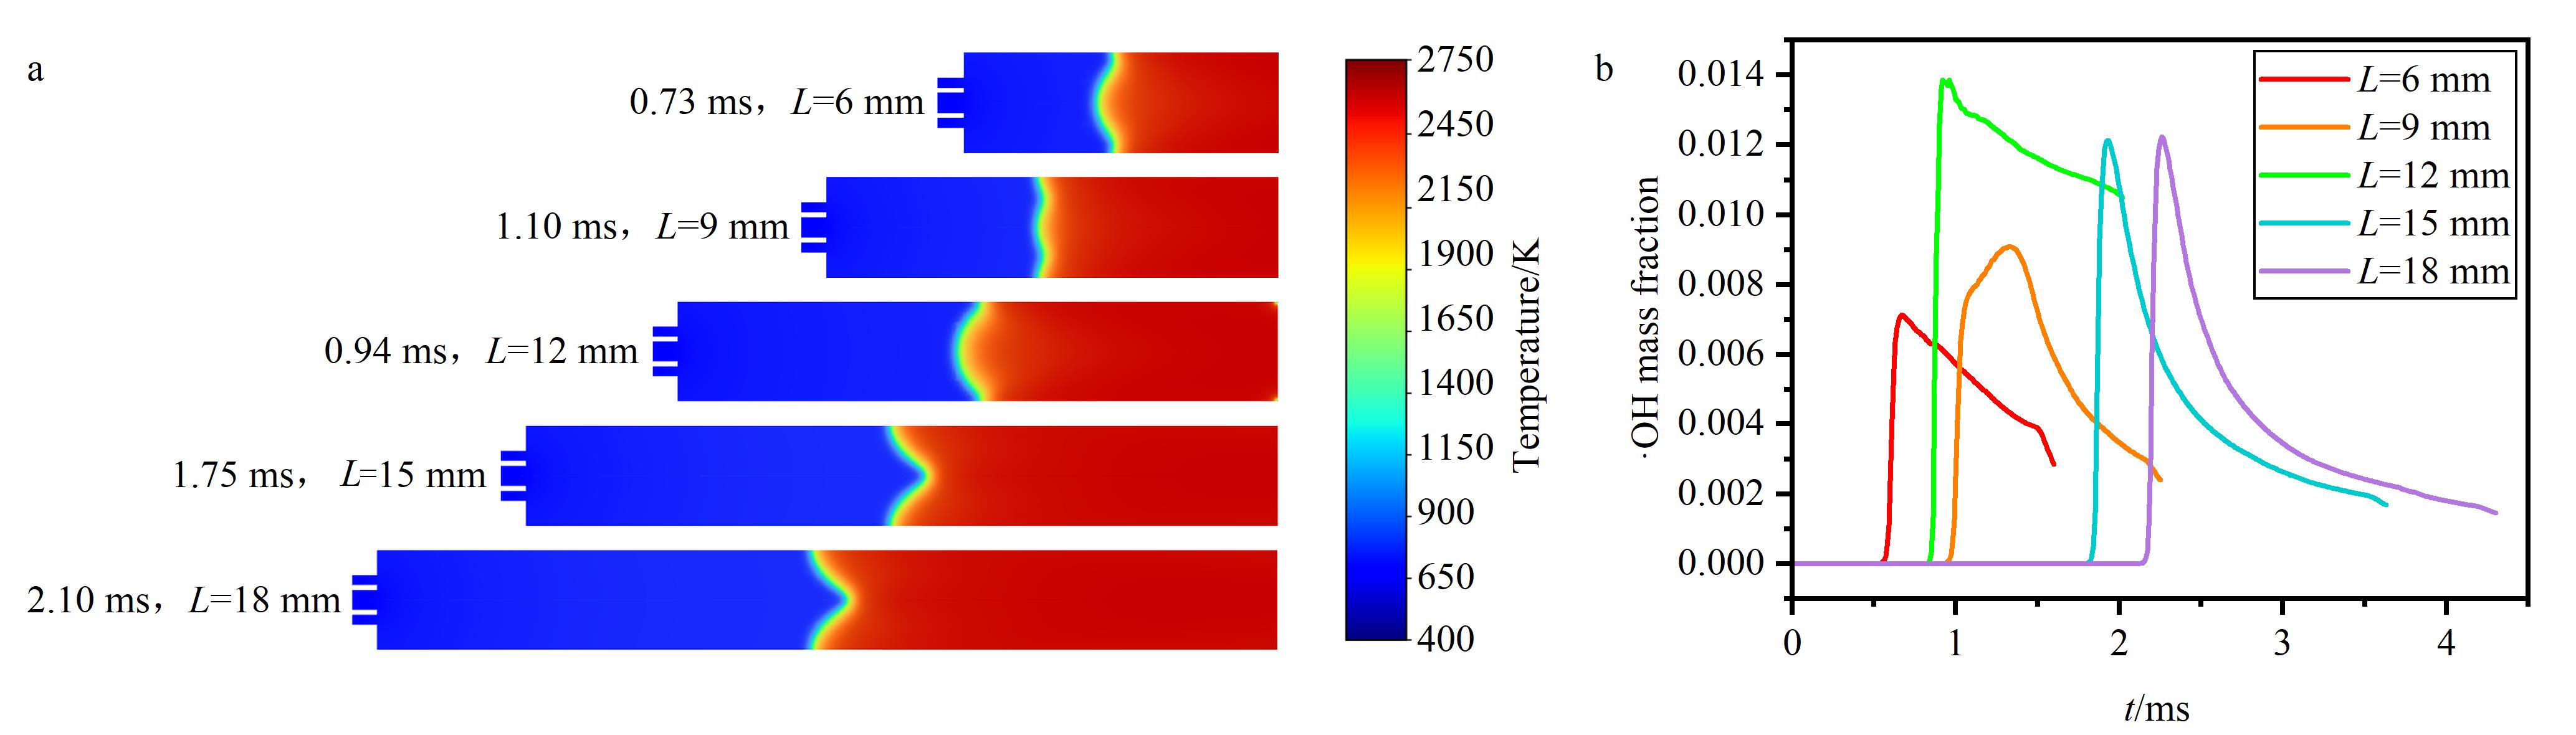
Fig. 2 Comparison of flame front morphology and ·OH response characteristics at different effective combustion chamber lengths (L)a. representative temperature field distributions of flame fronts at different effective lengths; b. transient ·OH mass fraction response curves at the midpoint of the chamber axis at different effective lengths.Combustion chamber inner diameter: 2 mm; combustion chamber H2 flow: 2.0 mL/min; combustion chamber air flow: 3.5 mL/min.
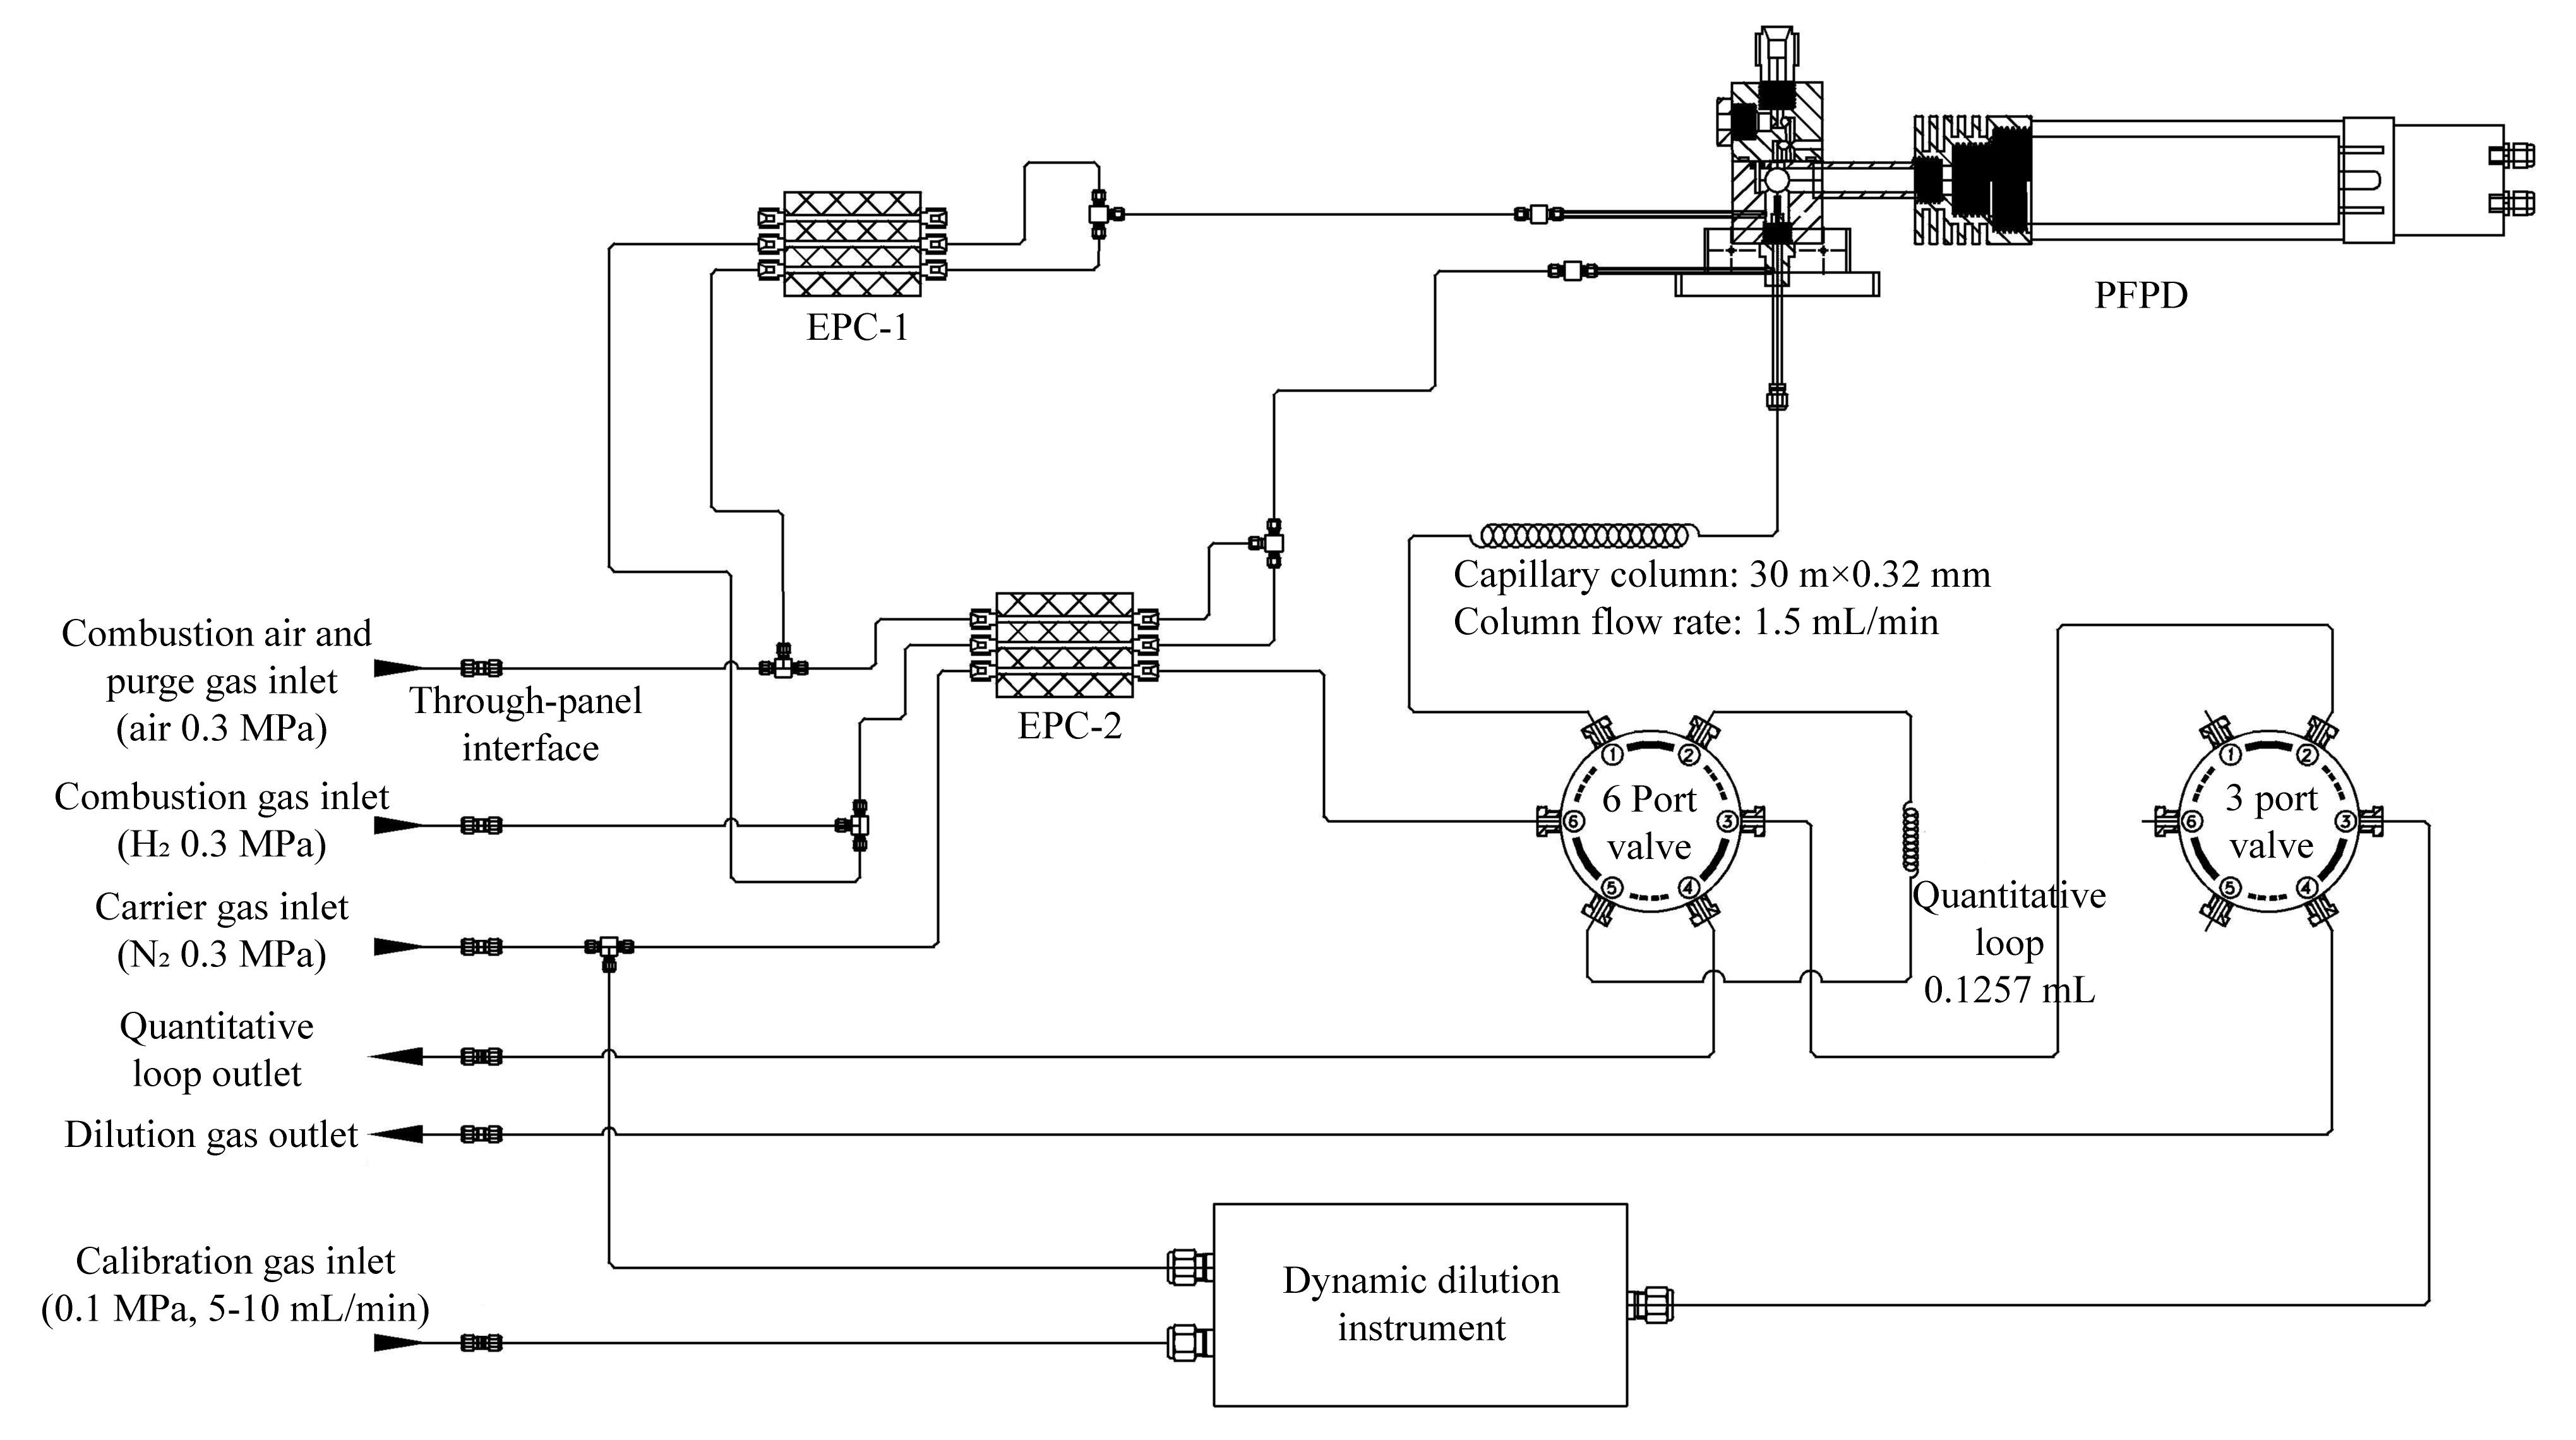
Fig. 3 PFPD gas flow diagramEPC: electronic pneumatic control. The gas flow diagram was prepared with the assistance of Shandong Lunan Ruihong Chemical Instrument Co., Ltd., based on the actual experimental system.
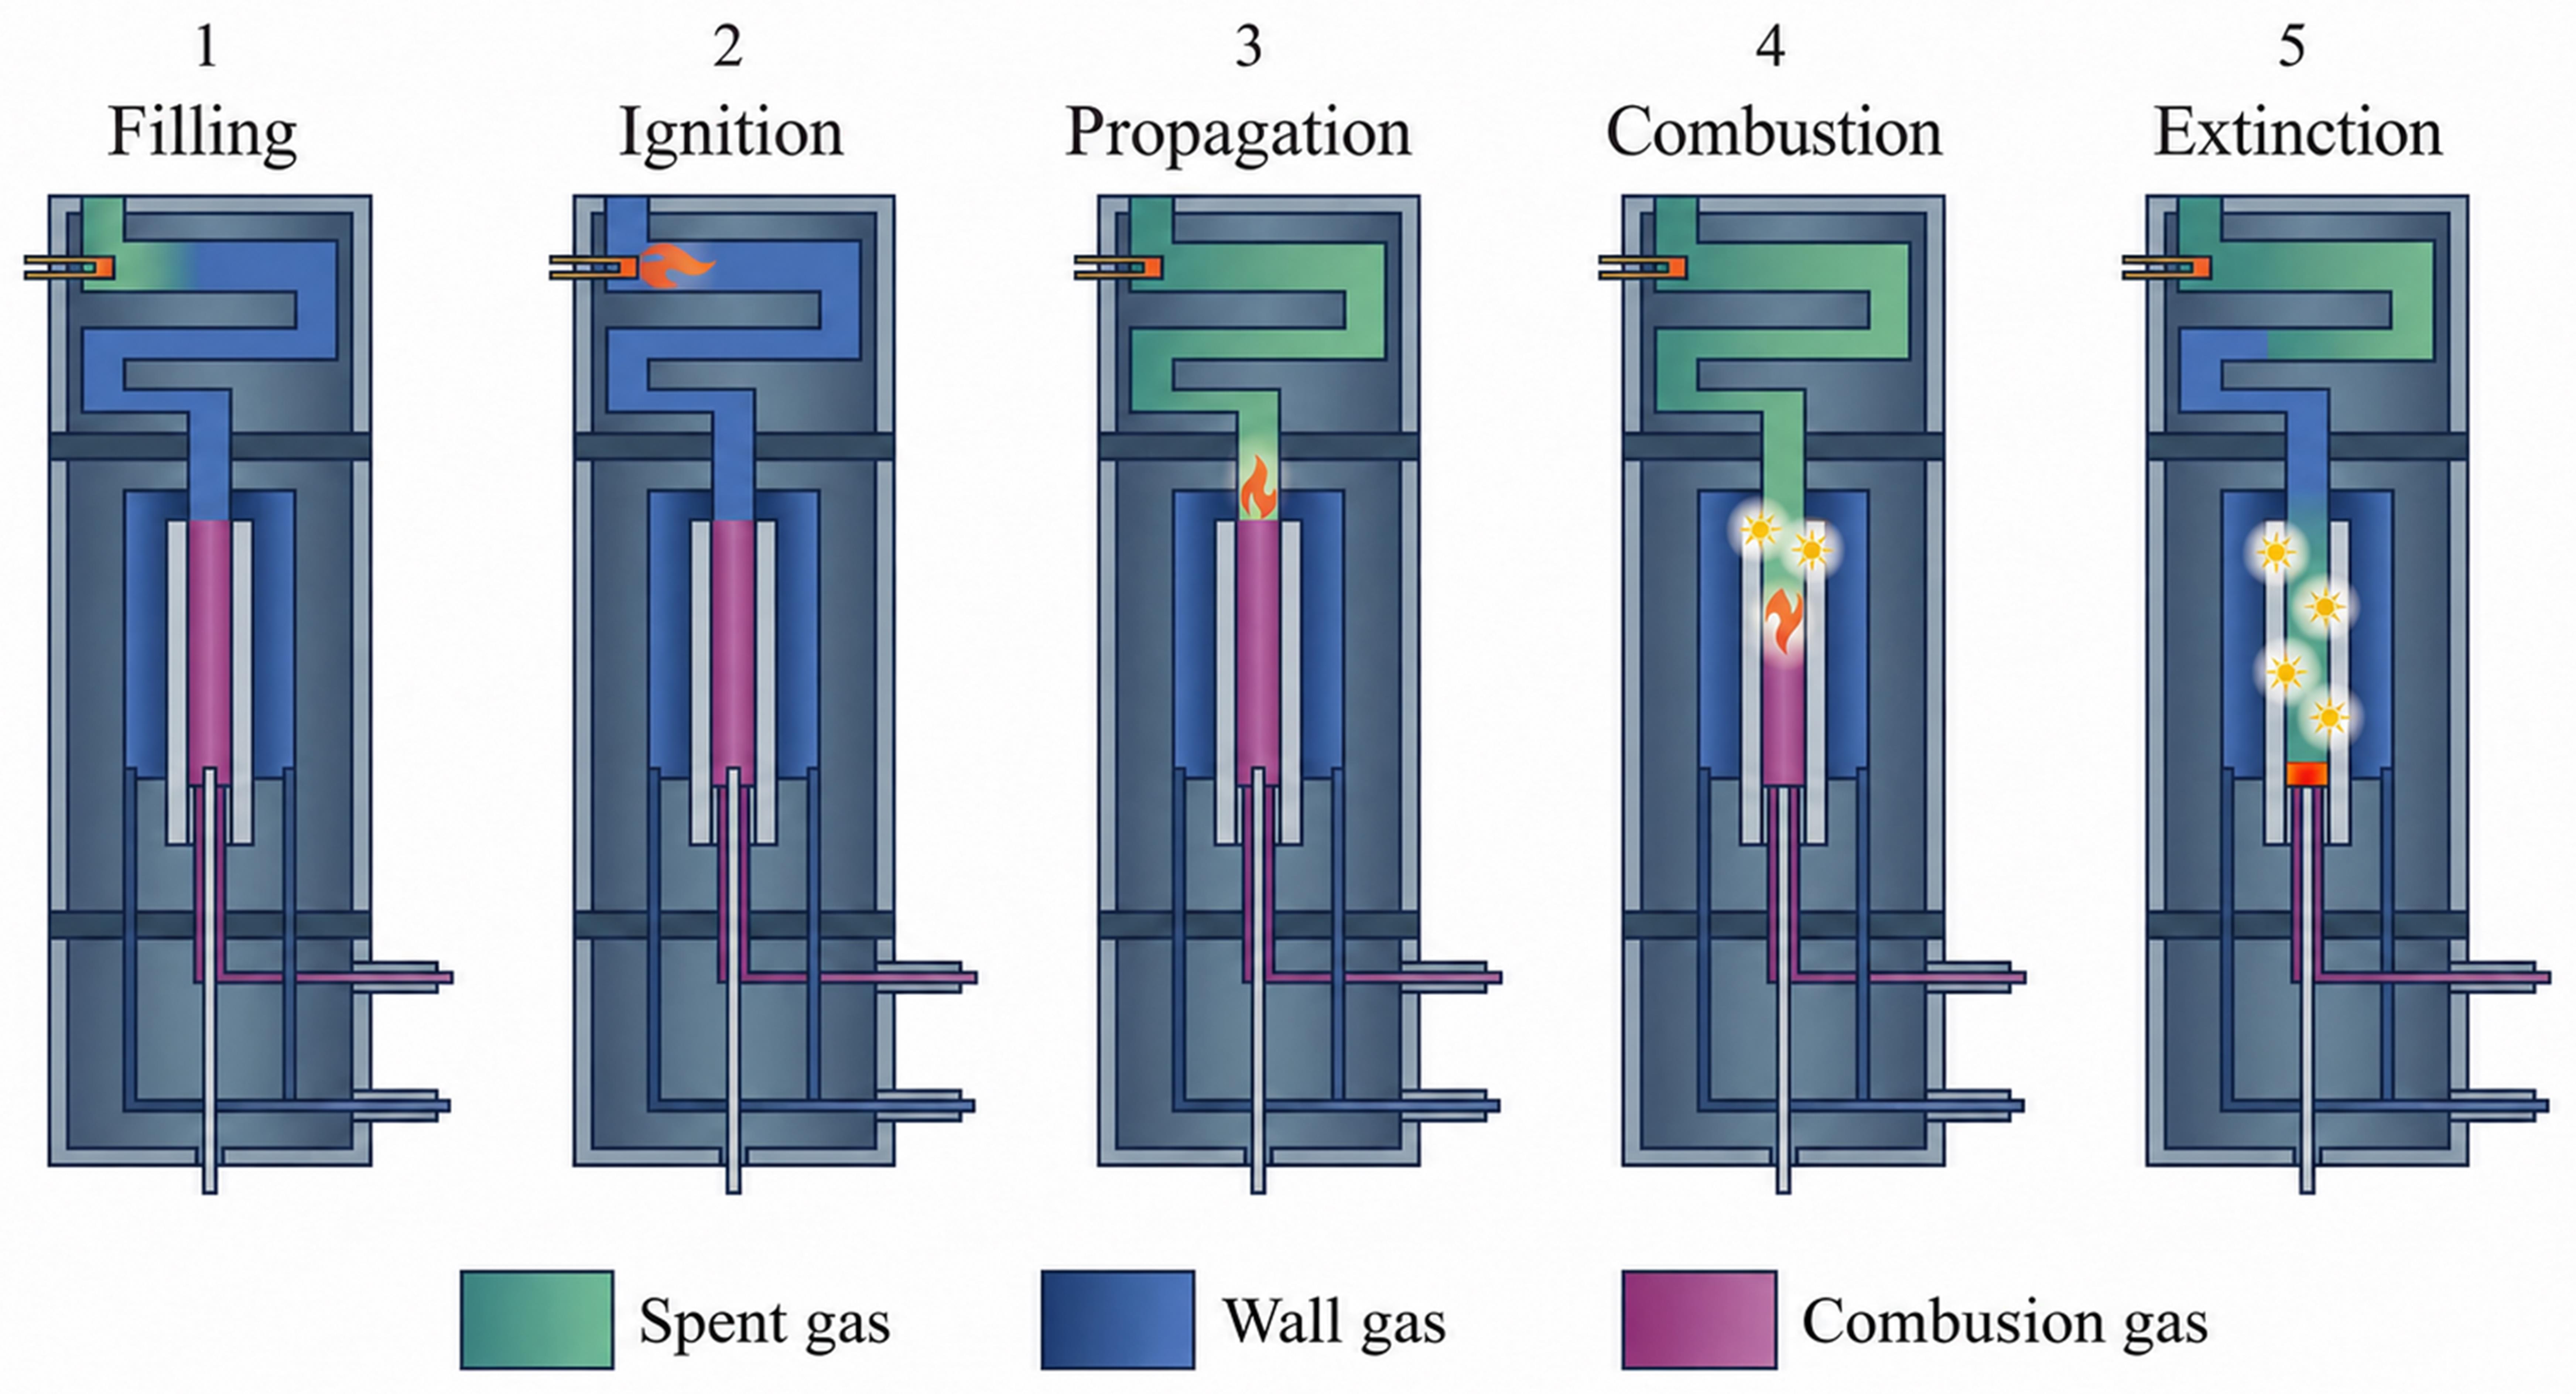
Fig. 4 PFPD operating principle
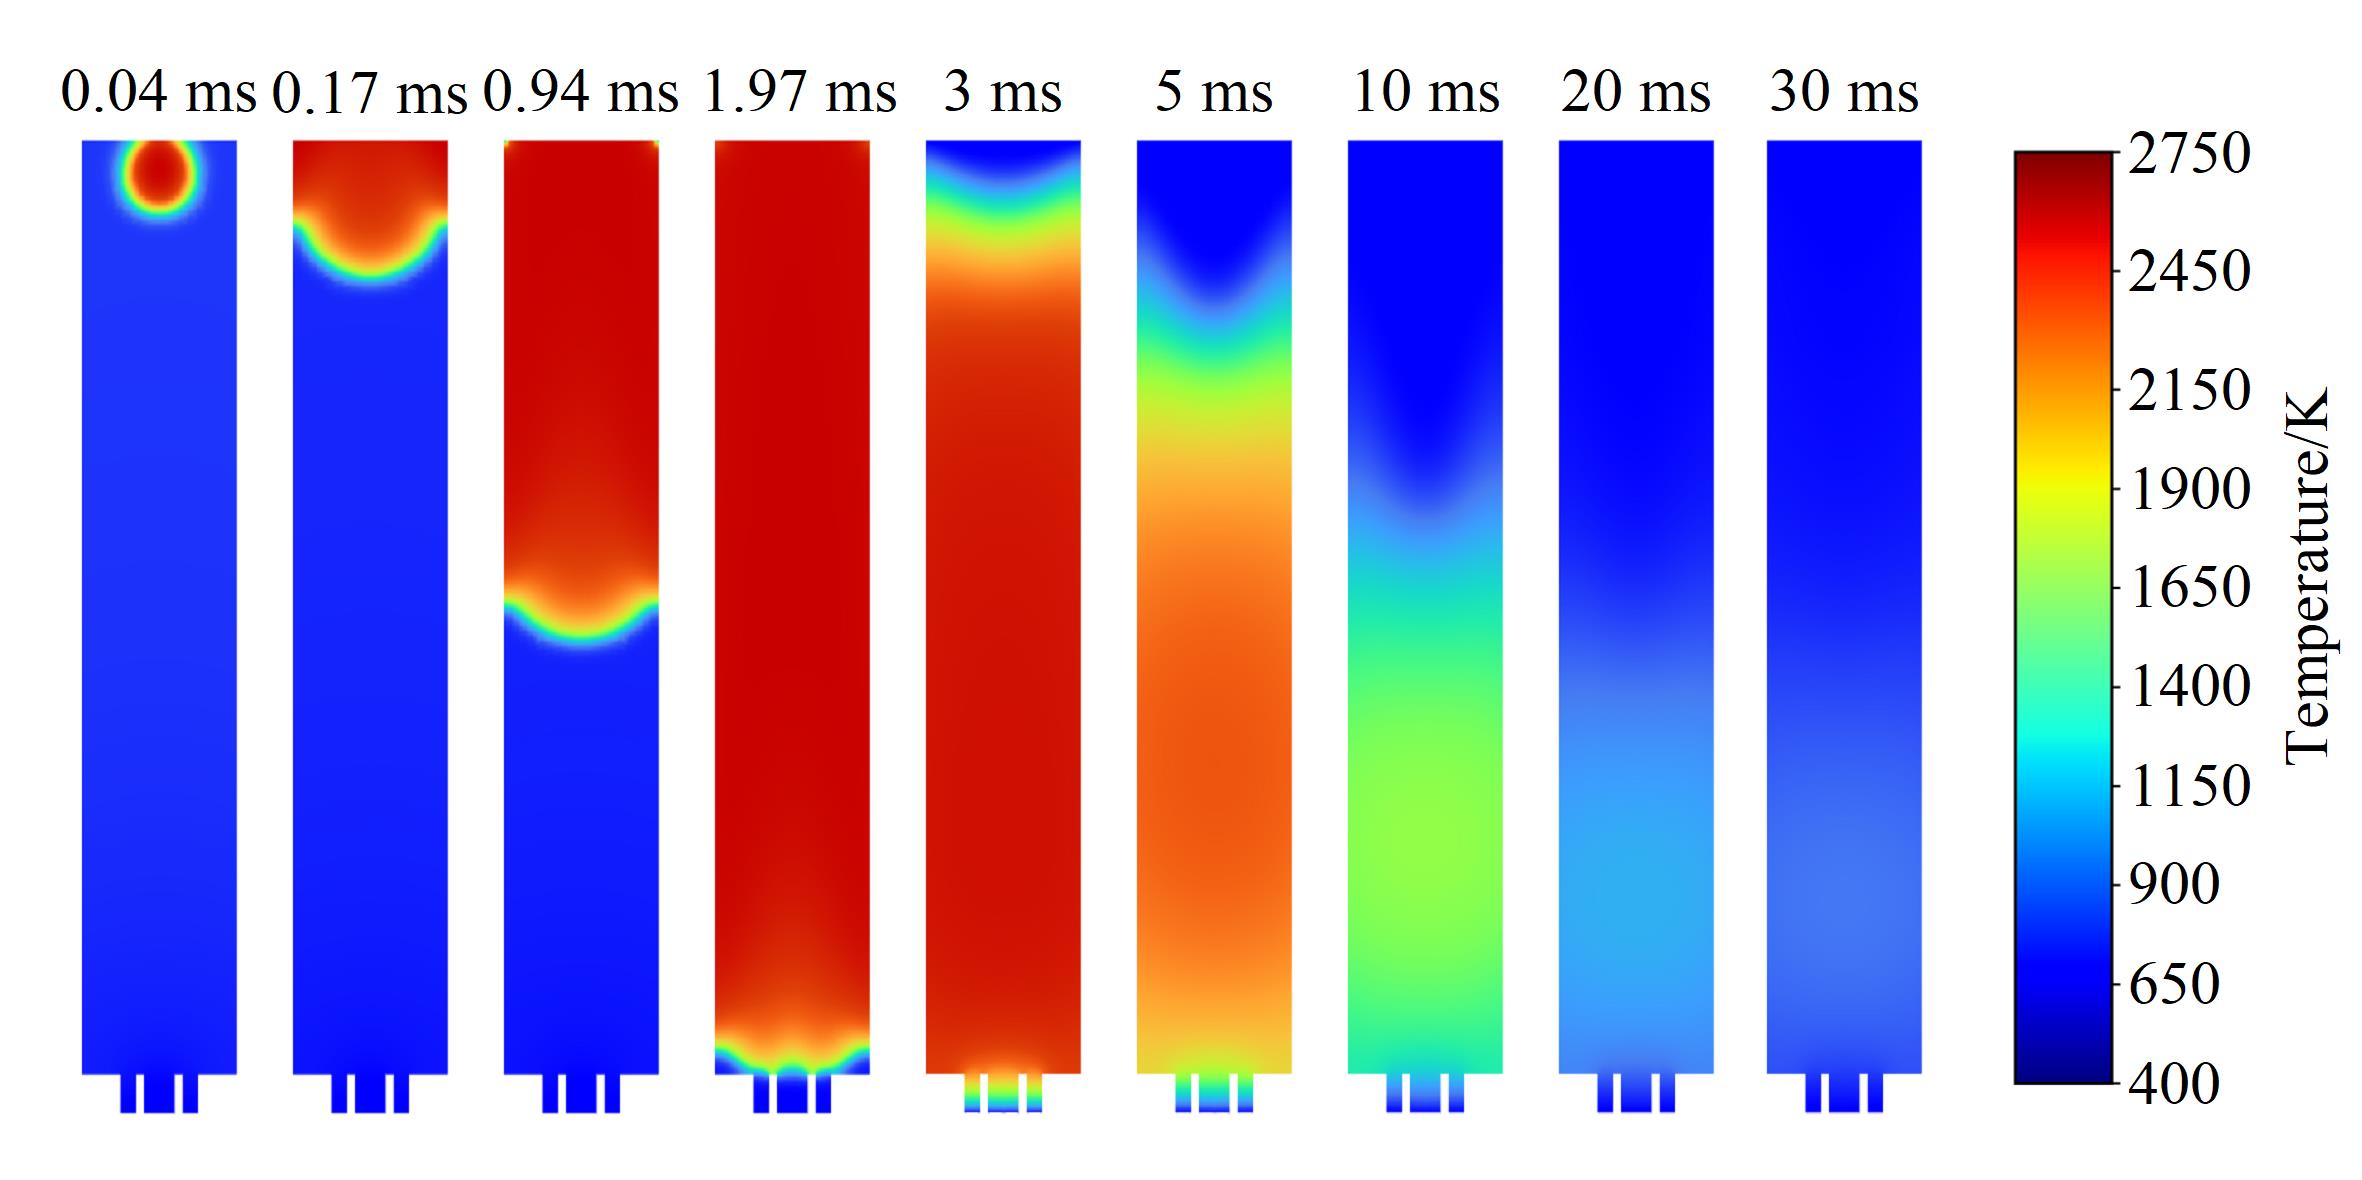
Fig. 5 Simulated temperature-field evolution during flame propagation and self-extinction in the combustion chamberEffective length: 12 mm. Other conditions are the same as in Fig. 2. The times shown on the panels denote the elapsed time after ignition.
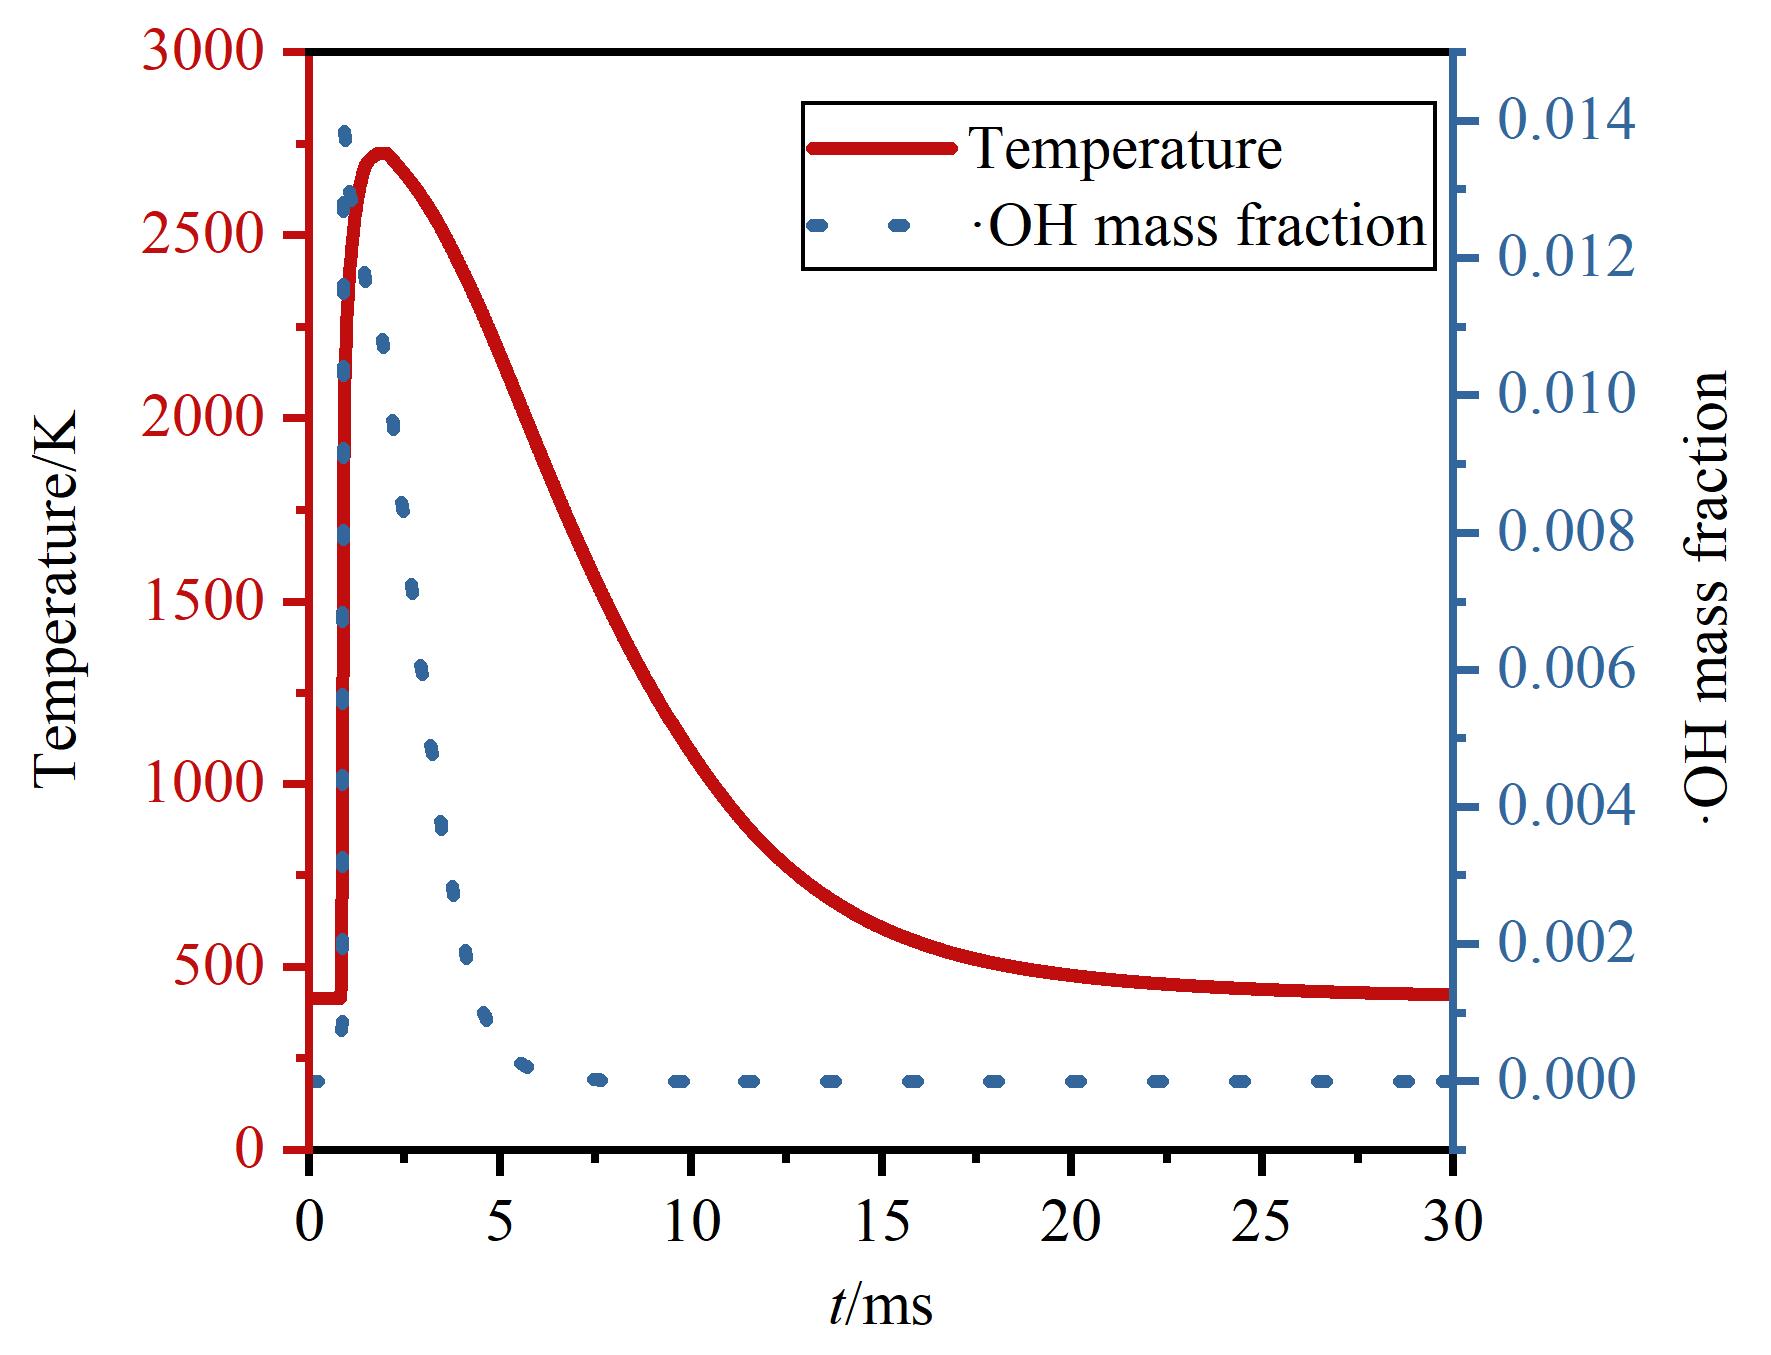
Fig. 6 Transient responses of ·OH mass fraction and temperature at the monitoring pointConditions are the same as in Fig. 5. The monitoring point is located at the midpoint of the chamber axis.
| Parameter | Value |
|---|---|
| Combustion chamber H2 flow/(mL/min) | 0 |
| Combustion chamber air flow/(mL/min) | 0 |
| Combustion chamber N2 flow/(mL/min) | 1.5 |
| Ignition chamber H2 flow/(mL/min) | 0 |
| Ignition chamber air flow/(mL/min) | 16.0 |
| PMT voltage/V | 630 |
| Trigger level/mV | 500 |
| Ignition voltage/V | 6.28 |
| Detector temperature/℃ | 150 |
Table 1 Independent ignition test conditions for the ignition chamber
| Parameter | Value |
|---|---|
| Combustion chamber H2 flow/(mL/min) | 0 |
| Combustion chamber air flow/(mL/min) | 0 |
| Combustion chamber N2 flow/(mL/min) | 1.5 |
| Ignition chamber H2 flow/(mL/min) | 0 |
| Ignition chamber air flow/(mL/min) | 16.0 |
| PMT voltage/V | 630 |
| Trigger level/mV | 500 |
| Ignition voltage/V | 6.28 |
| Detector temperature/℃ | 150 |
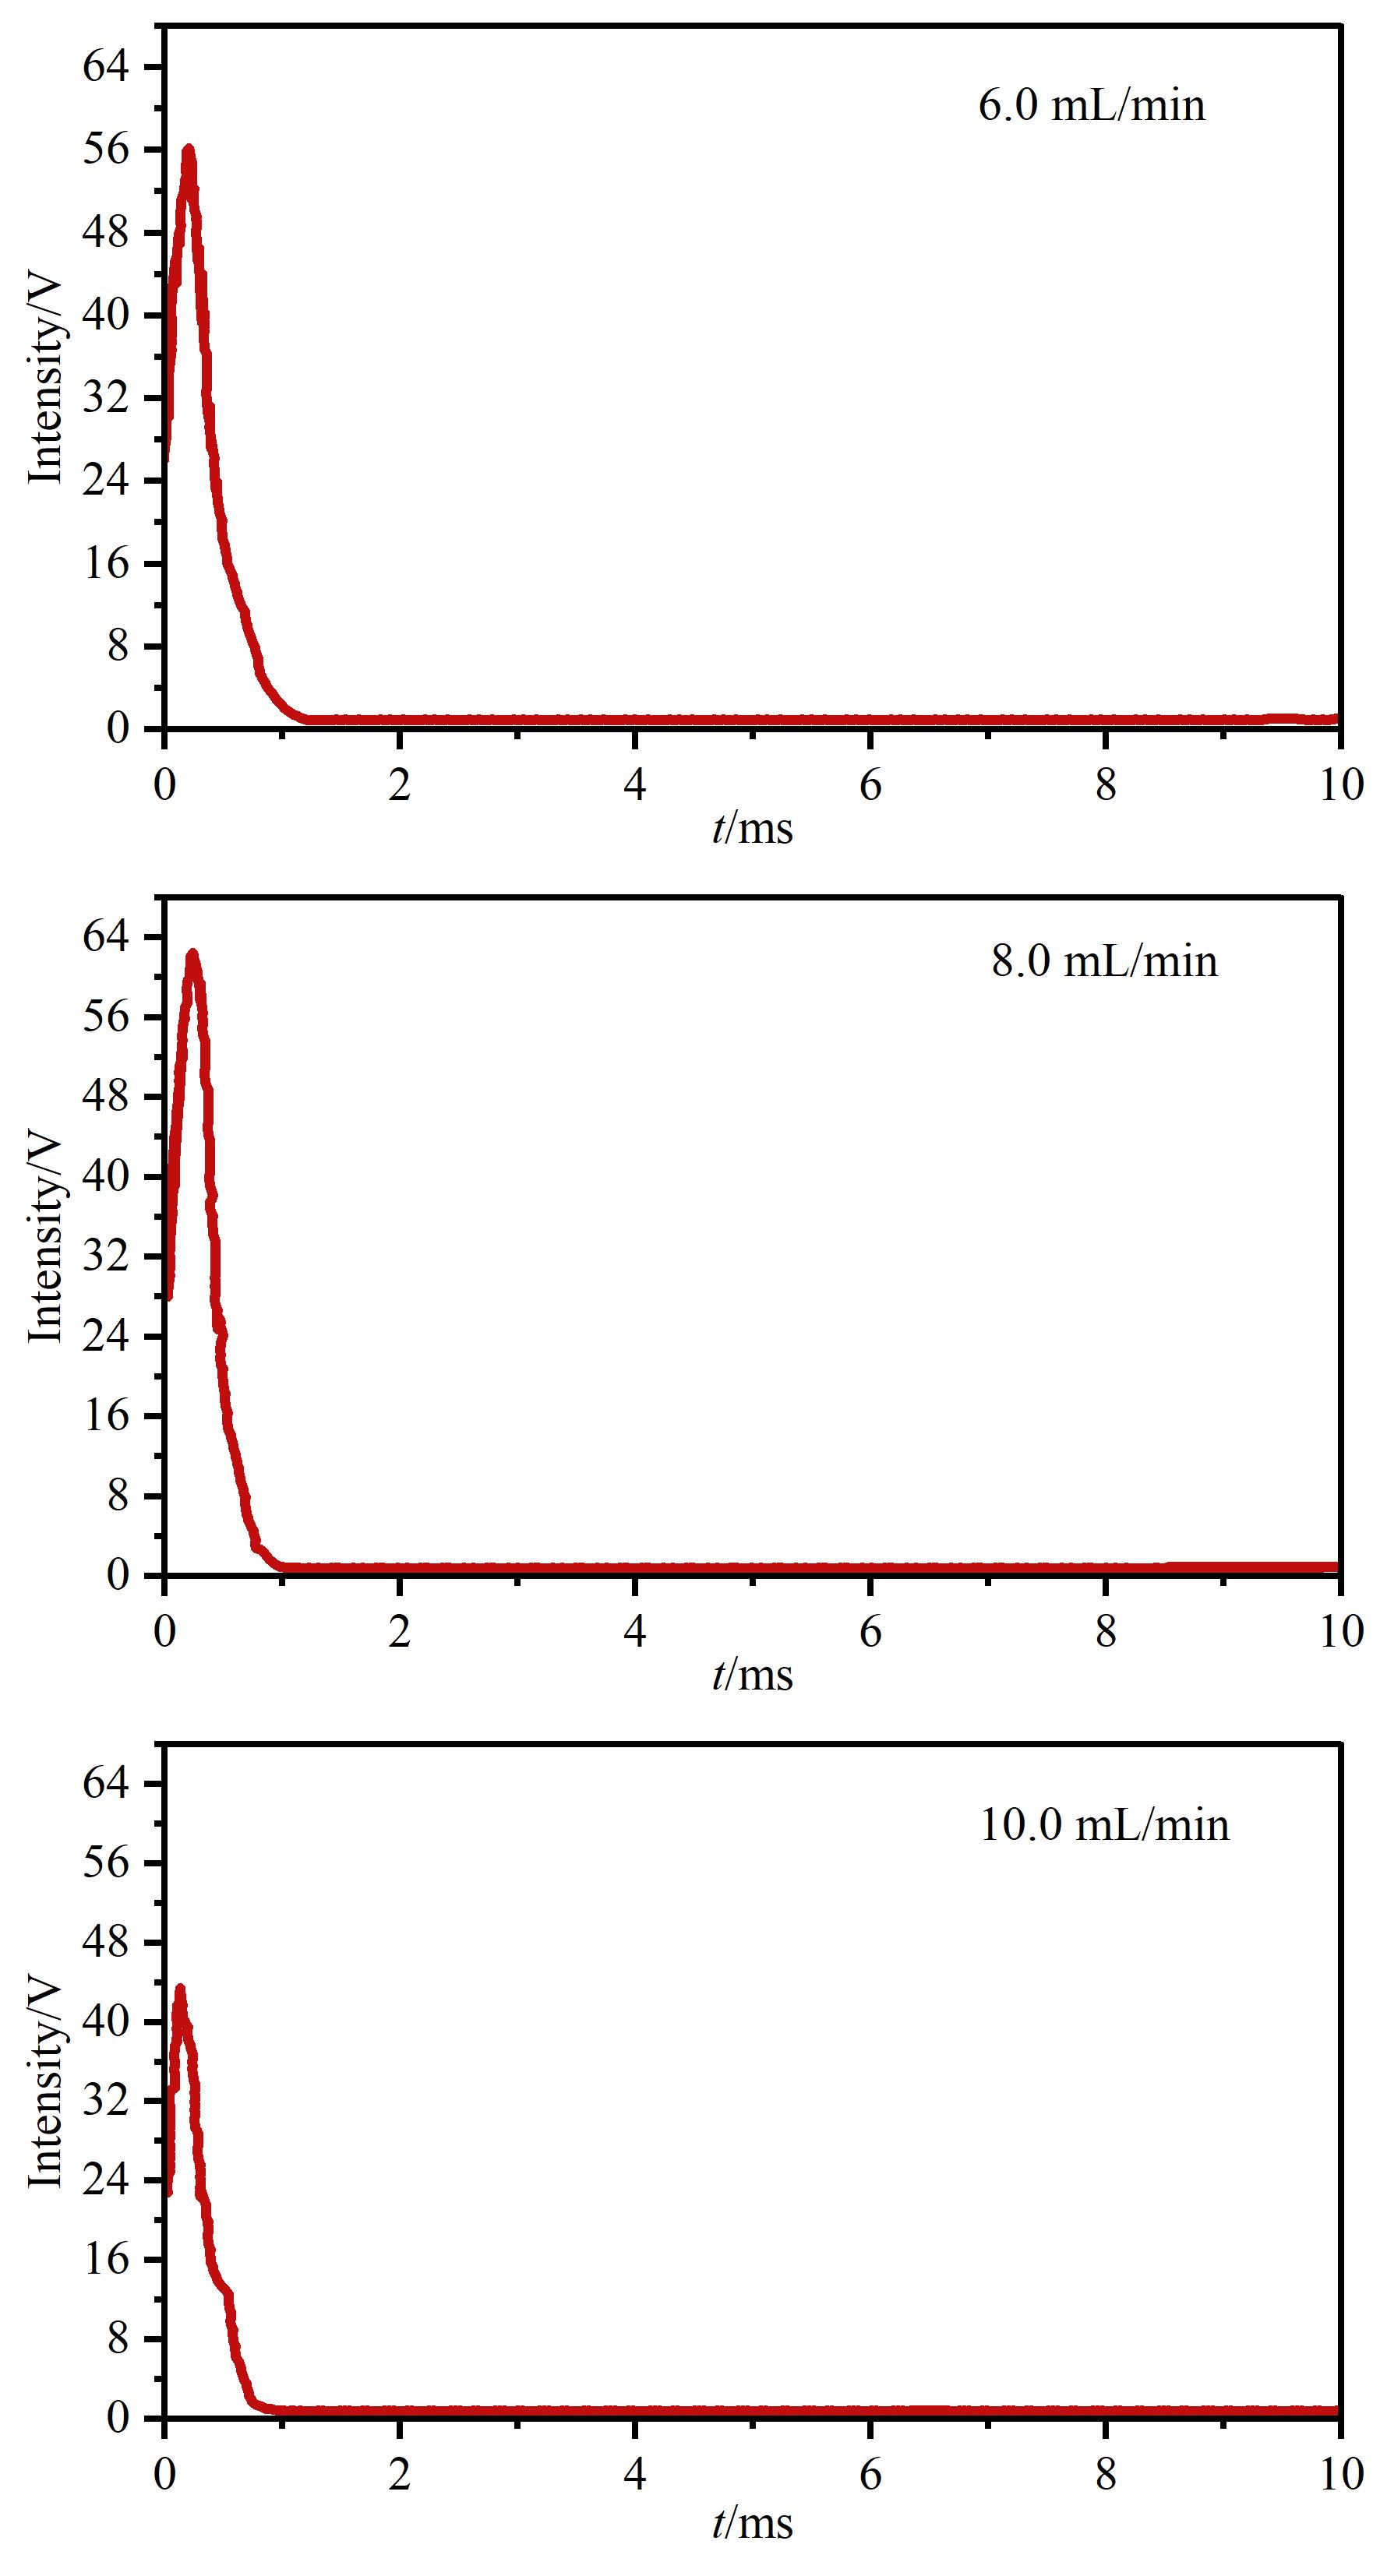
Fig. 7 Time waveform of combustion pulses under different ignition chamber H2 flow conditionsCombustion chamber H2 flow: 0 mL/min; combustion chamber air flow: 0 mL/min; ignition chamber air flow: 16.0 mL/min.
| Ignition chamber air flow/(mL/min) | Ignition chamber H2/Air | Combustion frequency/Hz |
|---|---|---|
| 13 | 0.62 | 0.64 |
| 14 | 0.57 | 2.08 |
| 15 | 0.53 | 2.56 |
| 16 | 0.50 | 3.03 |
| 17 | 0.47 | 3.23 |
| 18 | 0.44 | 3.57 |
| 19 | 0.42 | 3.85 |
Table 2 Gas flow ratios and combustion frequency at a constant ignition chamber H2 flow (8.0 mL/min) with stepwise increases in ignition chamber air flow
| Ignition chamber air flow/(mL/min) | Ignition chamber H2/Air | Combustion frequency/Hz |
|---|---|---|
| 13 | 0.62 | 0.64 |
| 14 | 0.57 | 2.08 |
| 15 | 0.53 | 2.56 |
| 16 | 0.50 | 3.03 |
| 17 | 0.47 | 3.23 |
| 18 | 0.44 | 3.57 |
| 19 | 0.42 | 3.85 |
| Combustion chamber H2 /(mL/min) | Combustion chamber H2/Air | Combustion frequency/Hz |
|---|---|---|
| 0 | 0 | 4.00 |
| 1.0 | 0.29 | 4.17 |
| 2.0 | 0.57 | 4.17 |
| 3.0 | 0.86 | 4.35 |
| 4.0 | 1.14 | 4.35 |
| 5.0 | 1.43 | 4.76 |
Table 3 Gas flow ratios and combustion frequency at a constant combustion chamber air flow (3.5 mL/min) with stepwise increases in combustion chamber H2 flow
| Combustion chamber H2 /(mL/min) | Combustion chamber H2/Air | Combustion frequency/Hz |
|---|---|---|
| 0 | 0 | 4.00 |
| 1.0 | 0.29 | 4.17 |
| 2.0 | 0.57 | 4.17 |
| 3.0 | 0.86 | 4.35 |
| 4.0 | 1.14 | 4.35 |
| 5.0 | 1.43 | 4.76 |
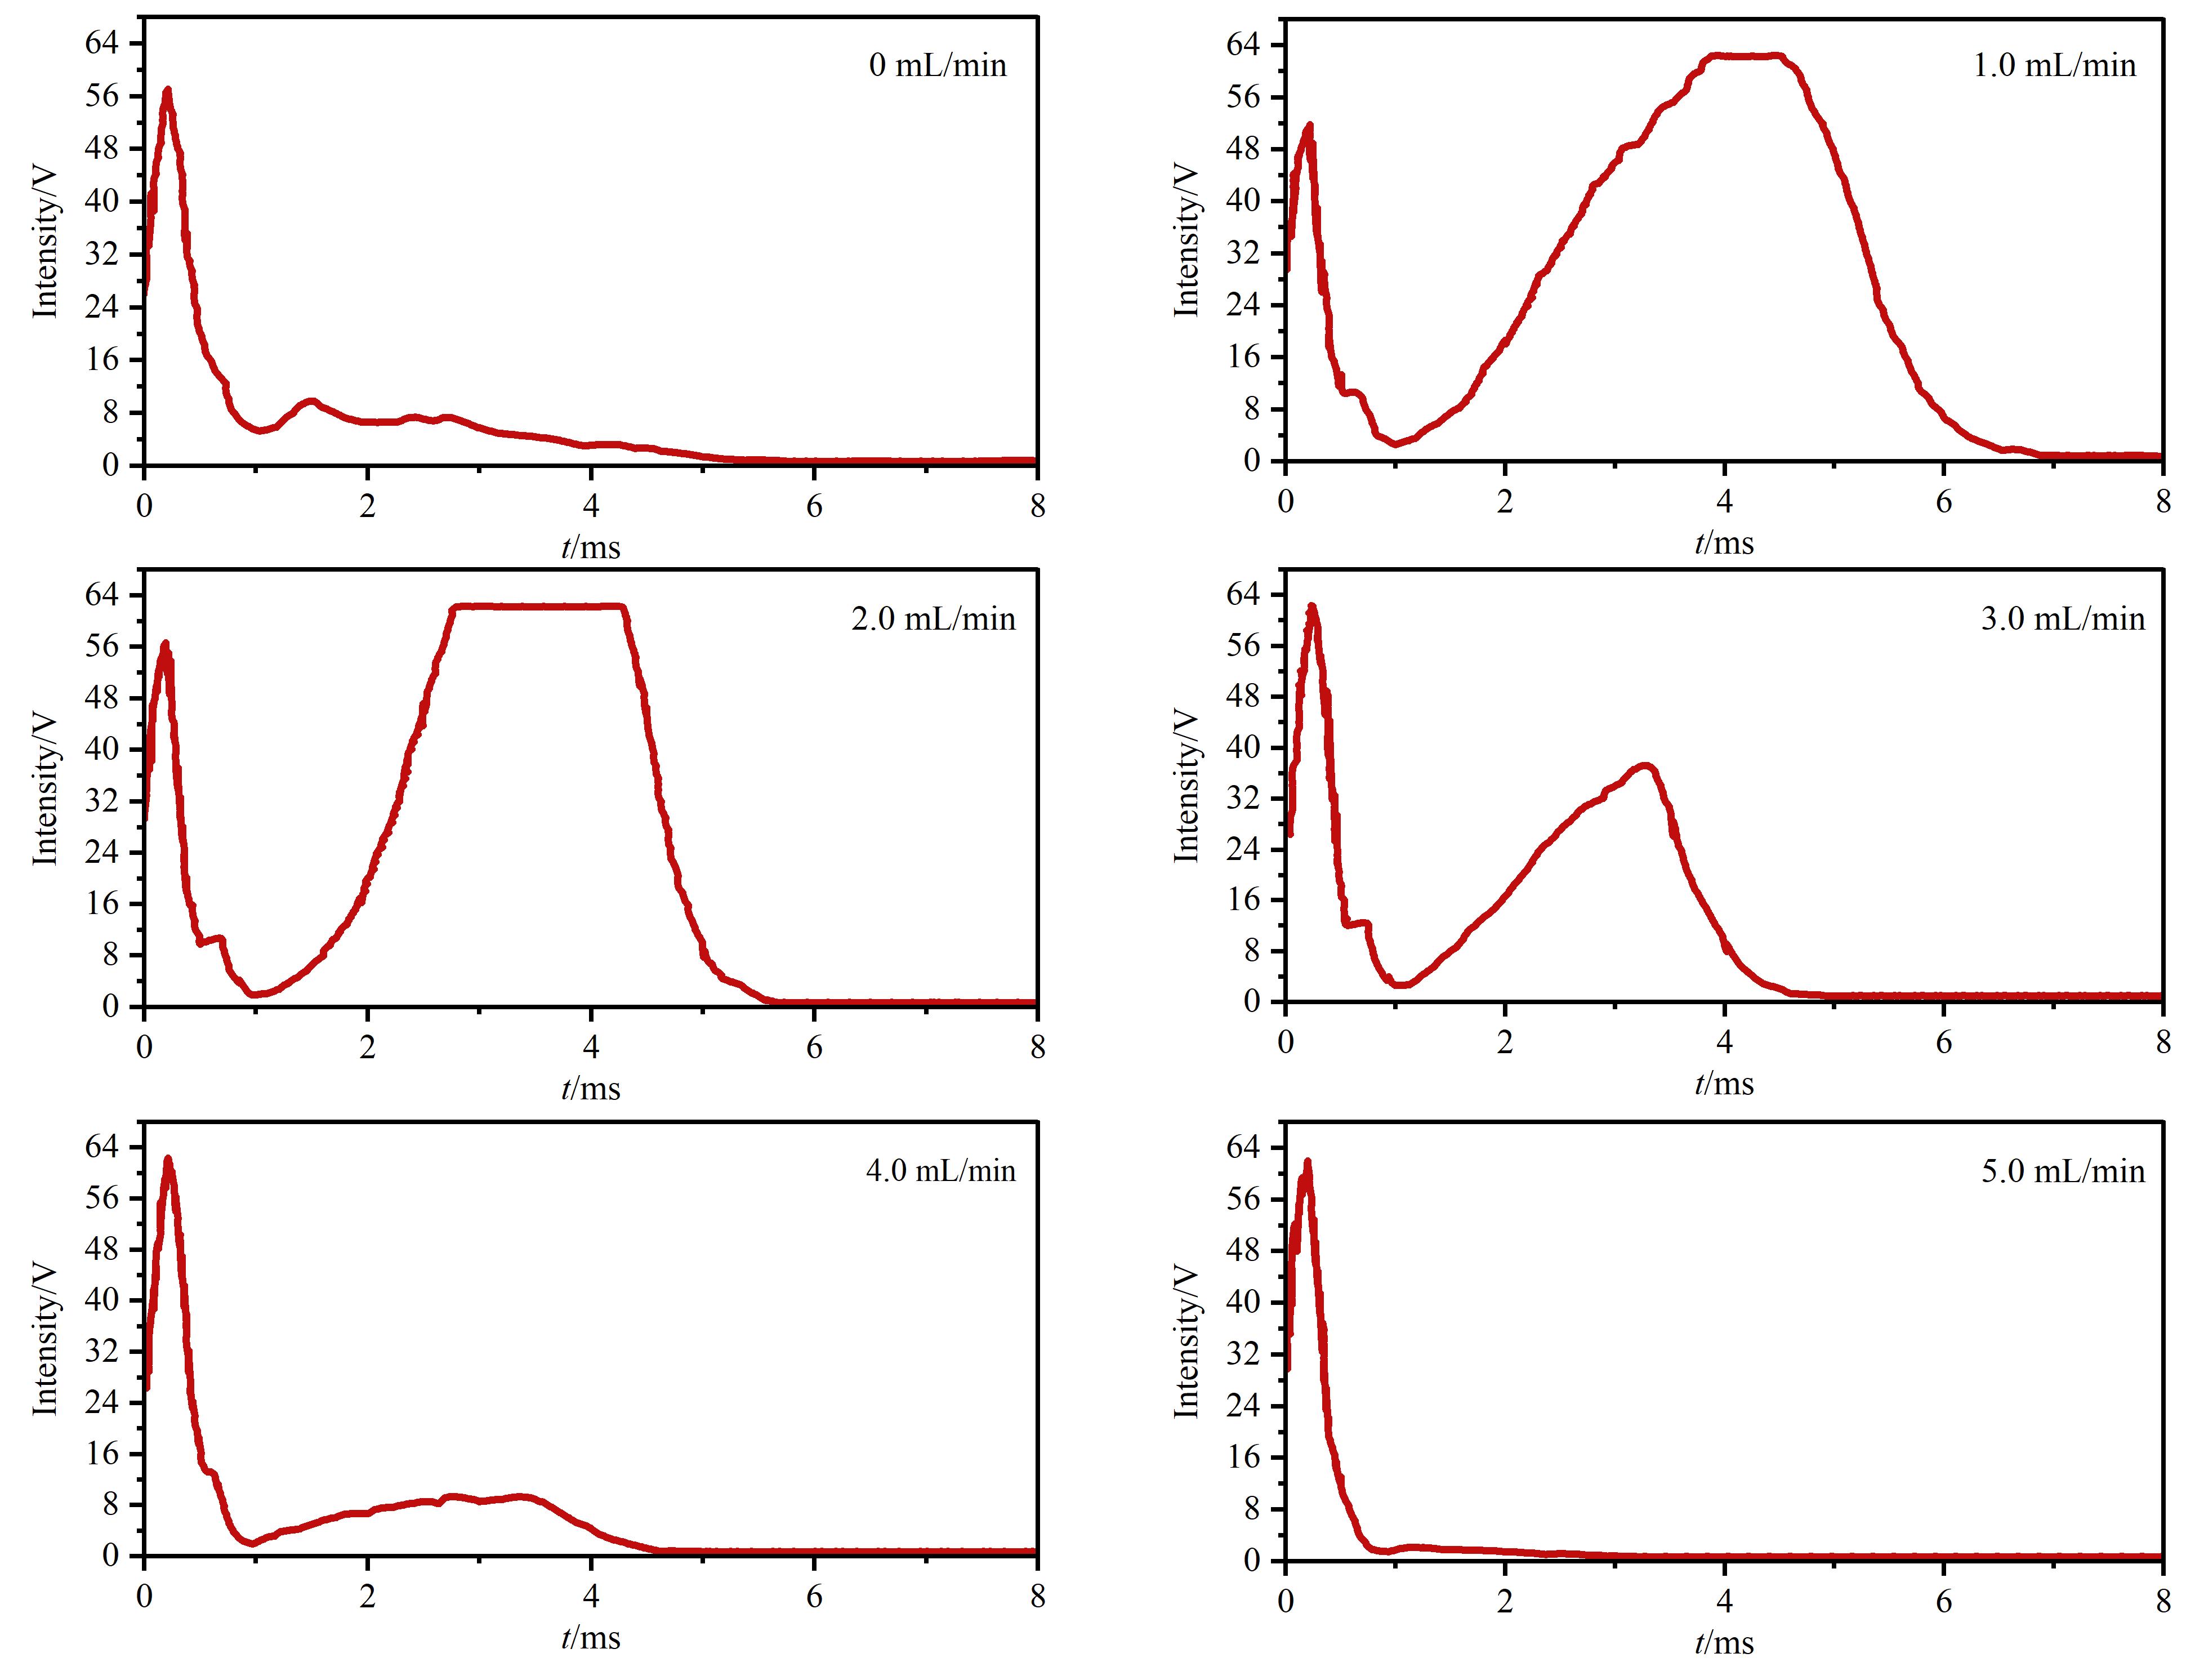
Fig. 8 Time waveform of combustion pulses under different H2 flow conditions in the combustion chamberCombustion chamber air flow: 3.5 mL/min; ignition chamber H2 flow: 8.0 mL/min; ignition chamber air flow: 19.0 mL/min.
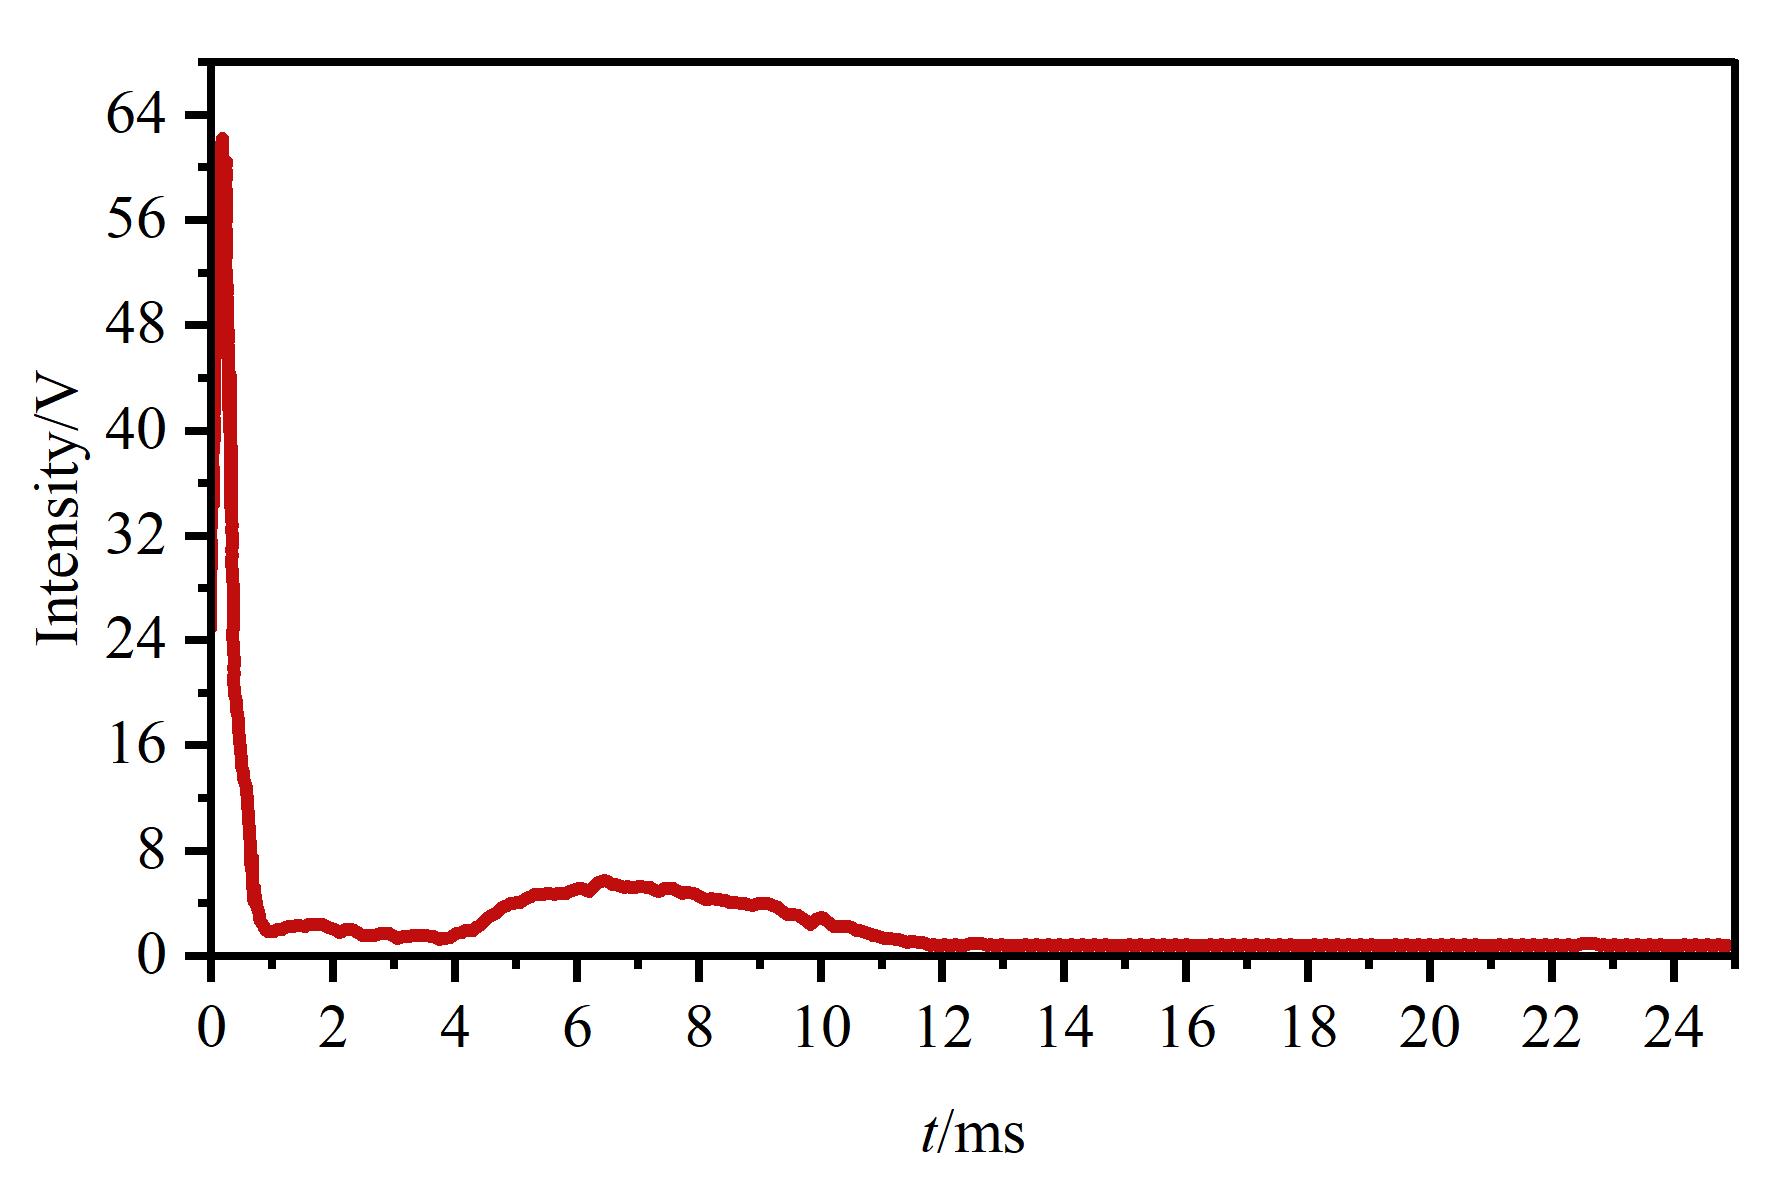
Fig. 9 Time waveform of sulfur luminescence response under oxygen-deficient conditionsCombustion chamber H2 flow: 5.0 mL/min; combustion chamber air flow: 3.5 mL/min; ignition chamber H2 flow: 8.0 mL/min; ignition chamber air flow: 19.0 mL/min.
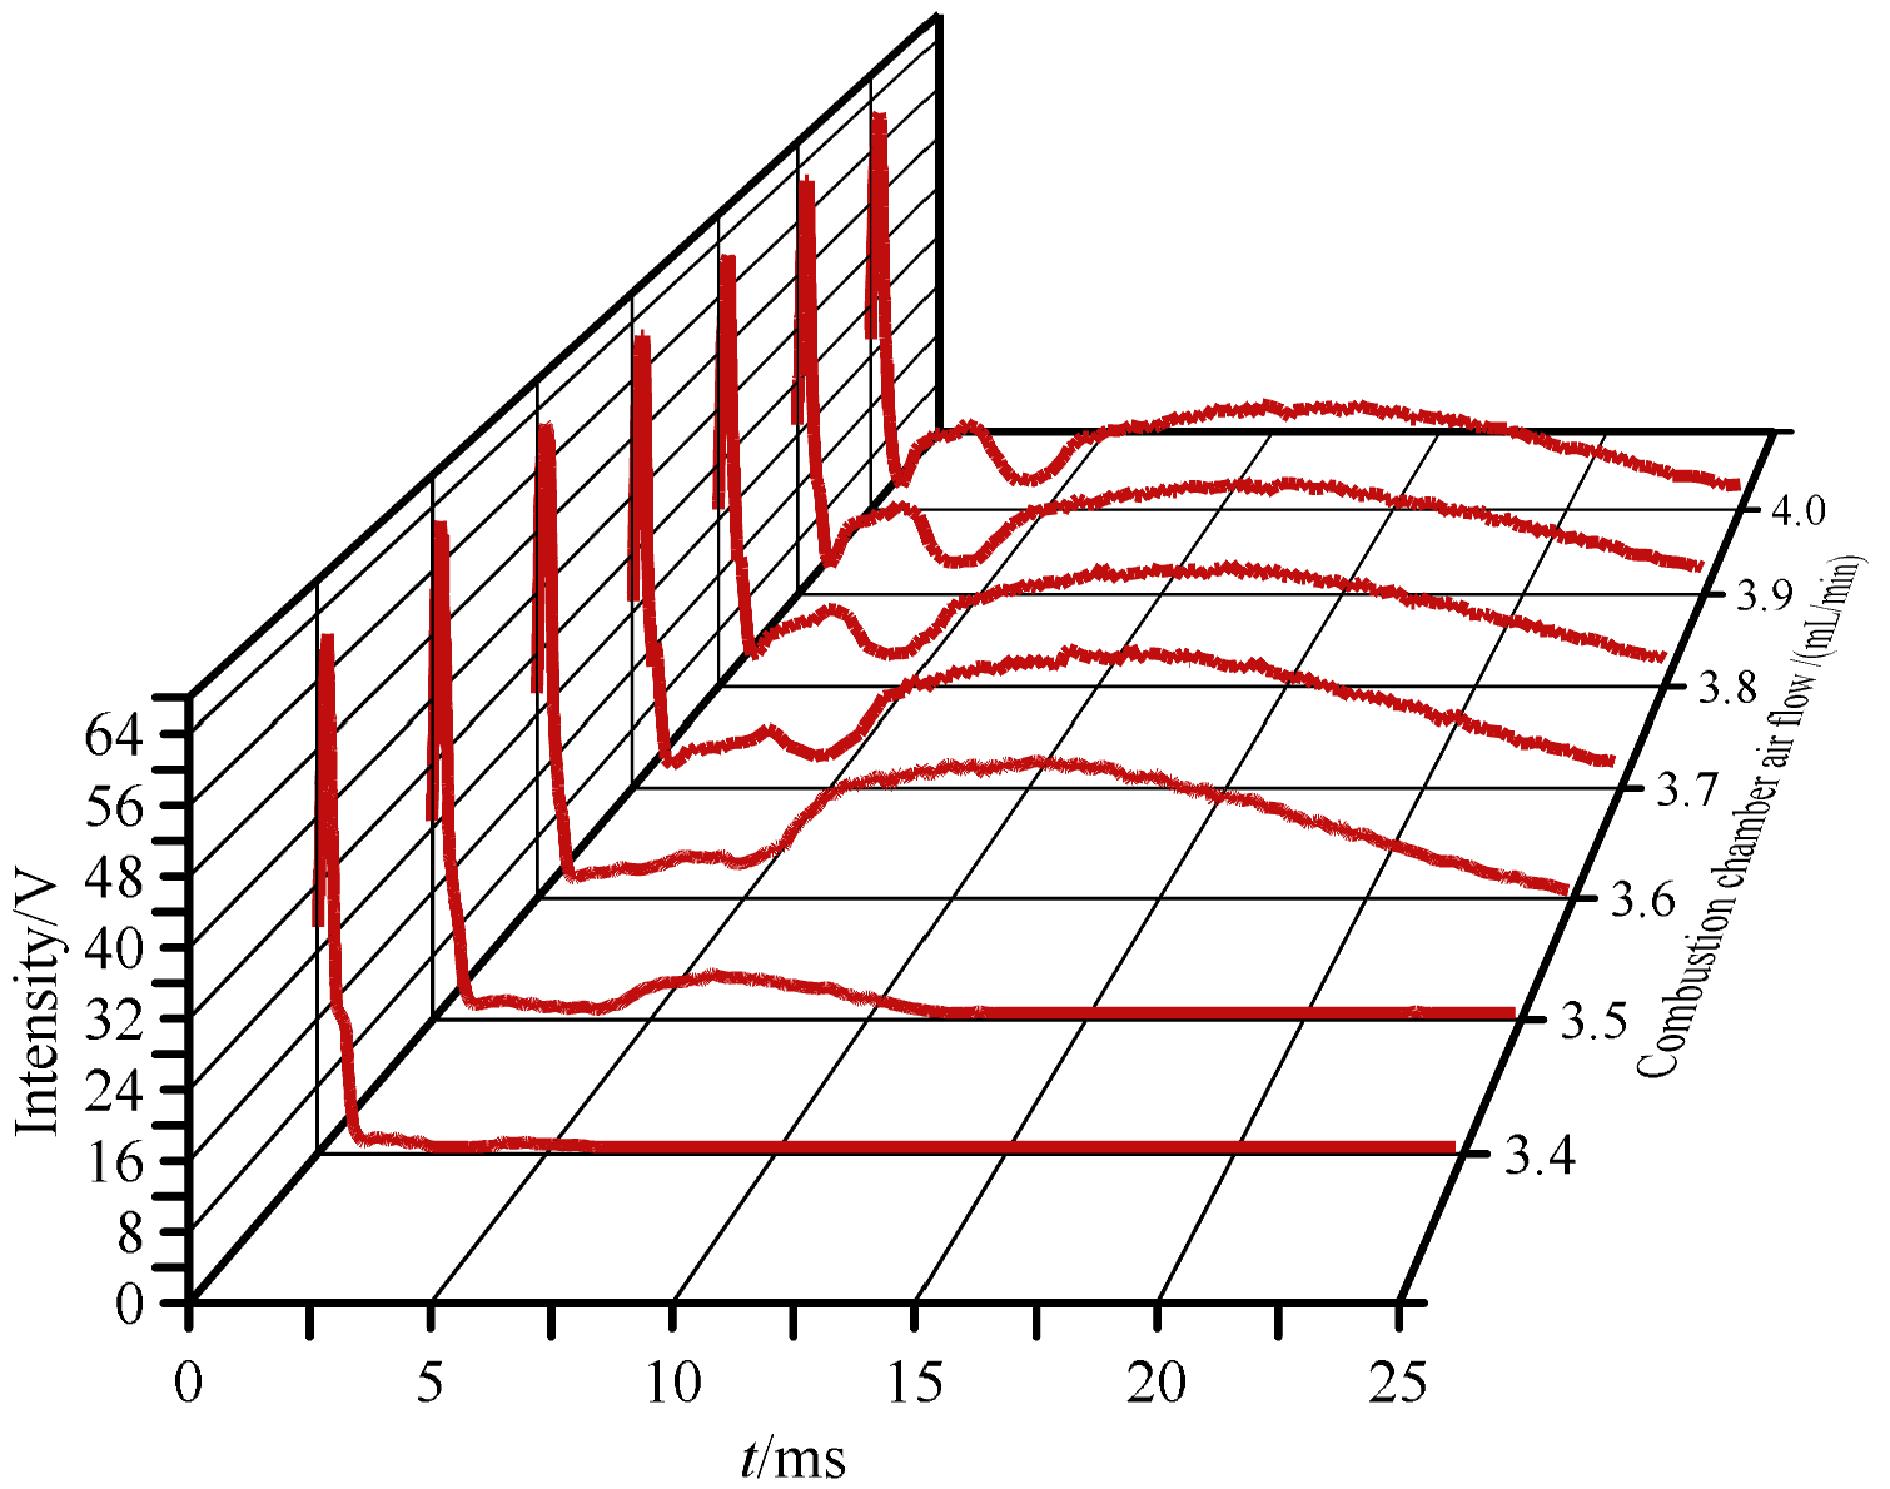
Fig. 10 Three-dimensional overlay of sulfur luminescence response at different combustion chamber air flow ratesCombustion chamber H2 flow: 5.0 mL/min; ignition chamber H2 flow: 8.0 mL/min; ignition chamber air flow: 19.0 mL/min
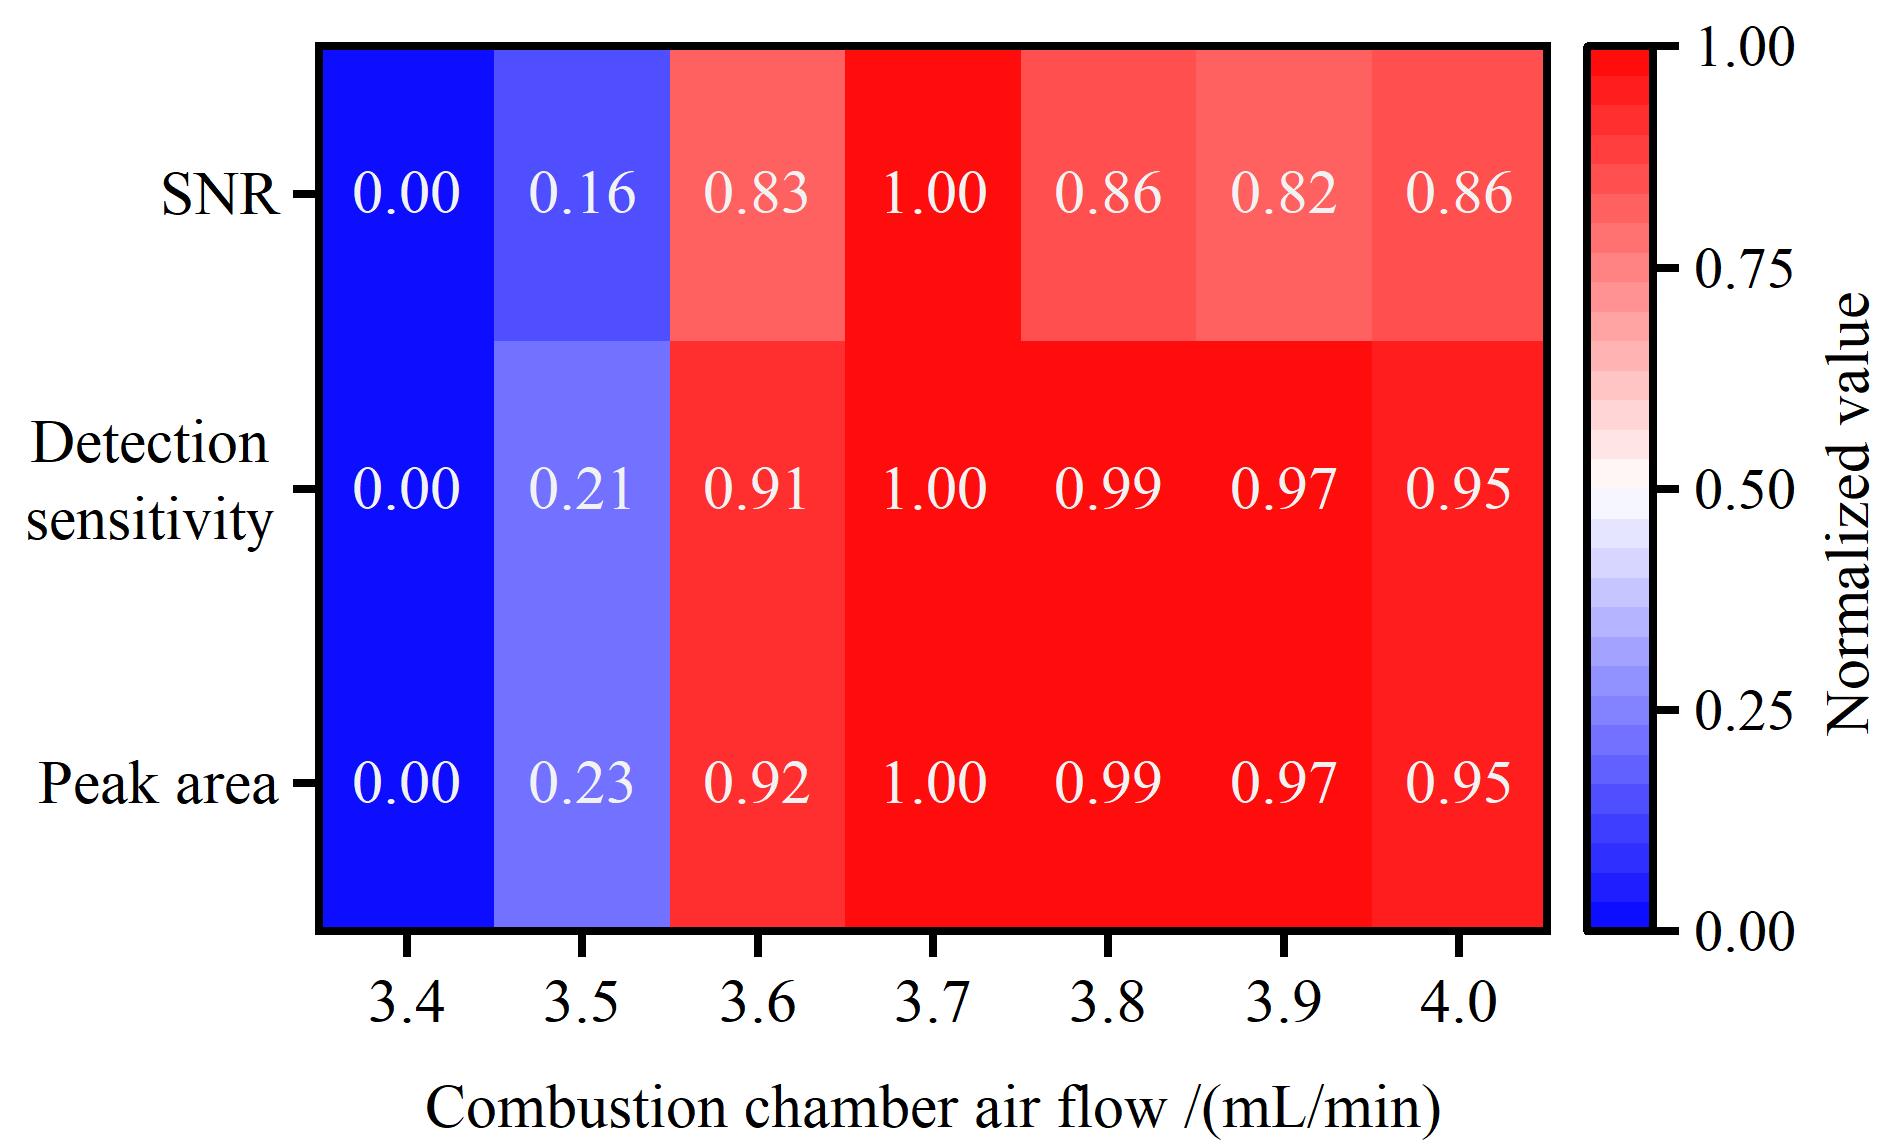
Fig. 11 Heat map of peak area, detection sensitivity, and signal-to-noise ratio (SNR) as a function of combustion-chamber air flow rate (Data normalized)
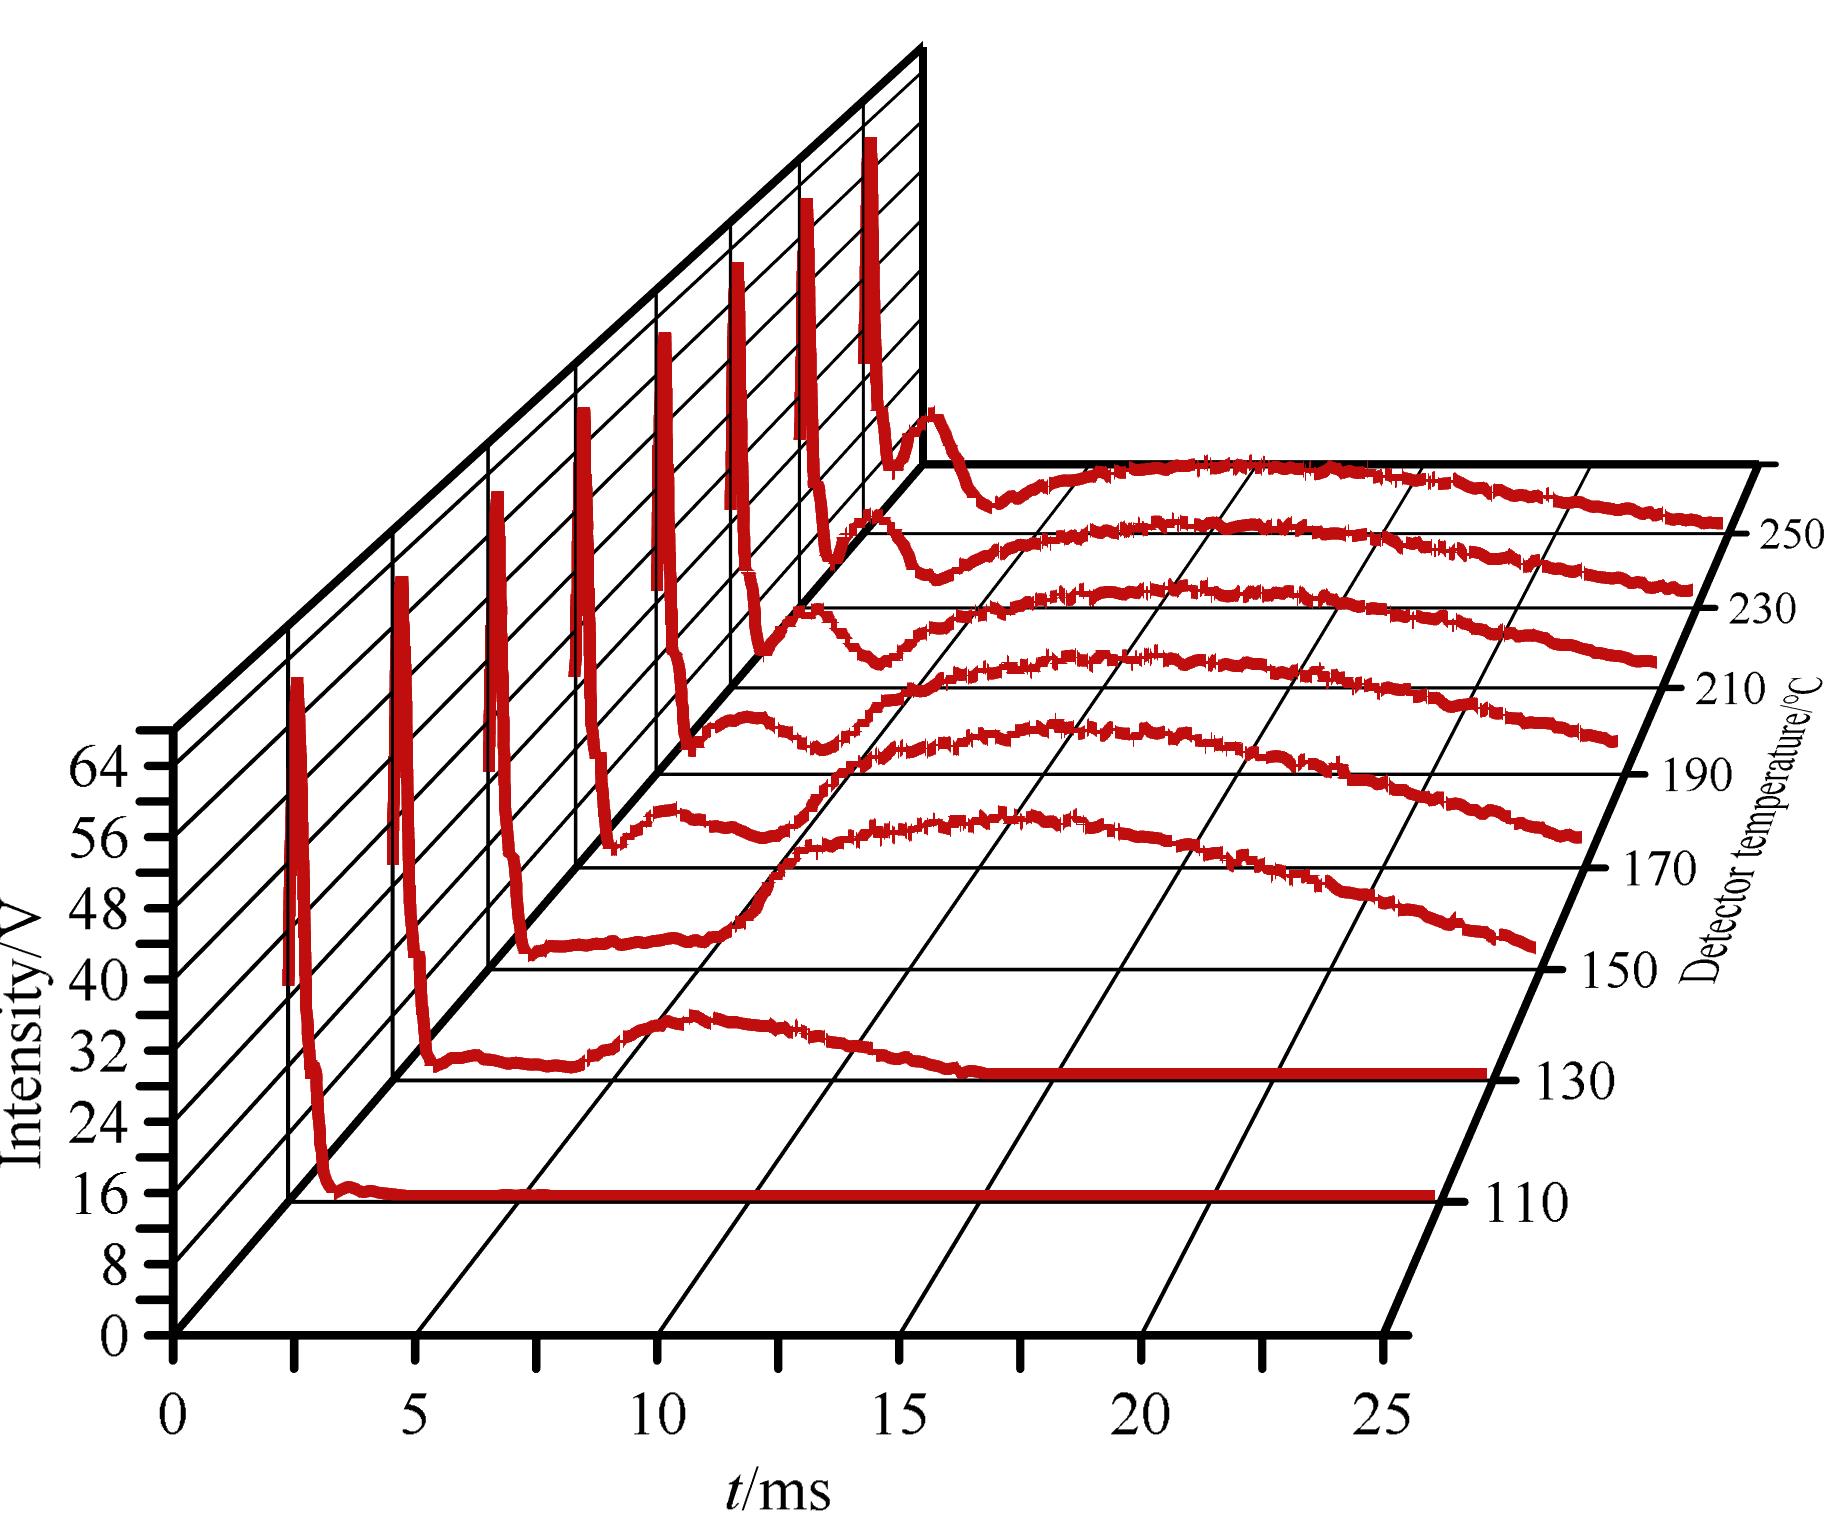
Fig. 12 Three-dimensional overlay of sulfur luminescence response at different detector temperaturesCombustion chamber H2 flow: 5.0 mL/min; combustion chamber air flow: 3.7 mL/min; ignition chamber H2 flow: 8.0 mL/min; ignition chamber air flow: 19.0 mL/min.
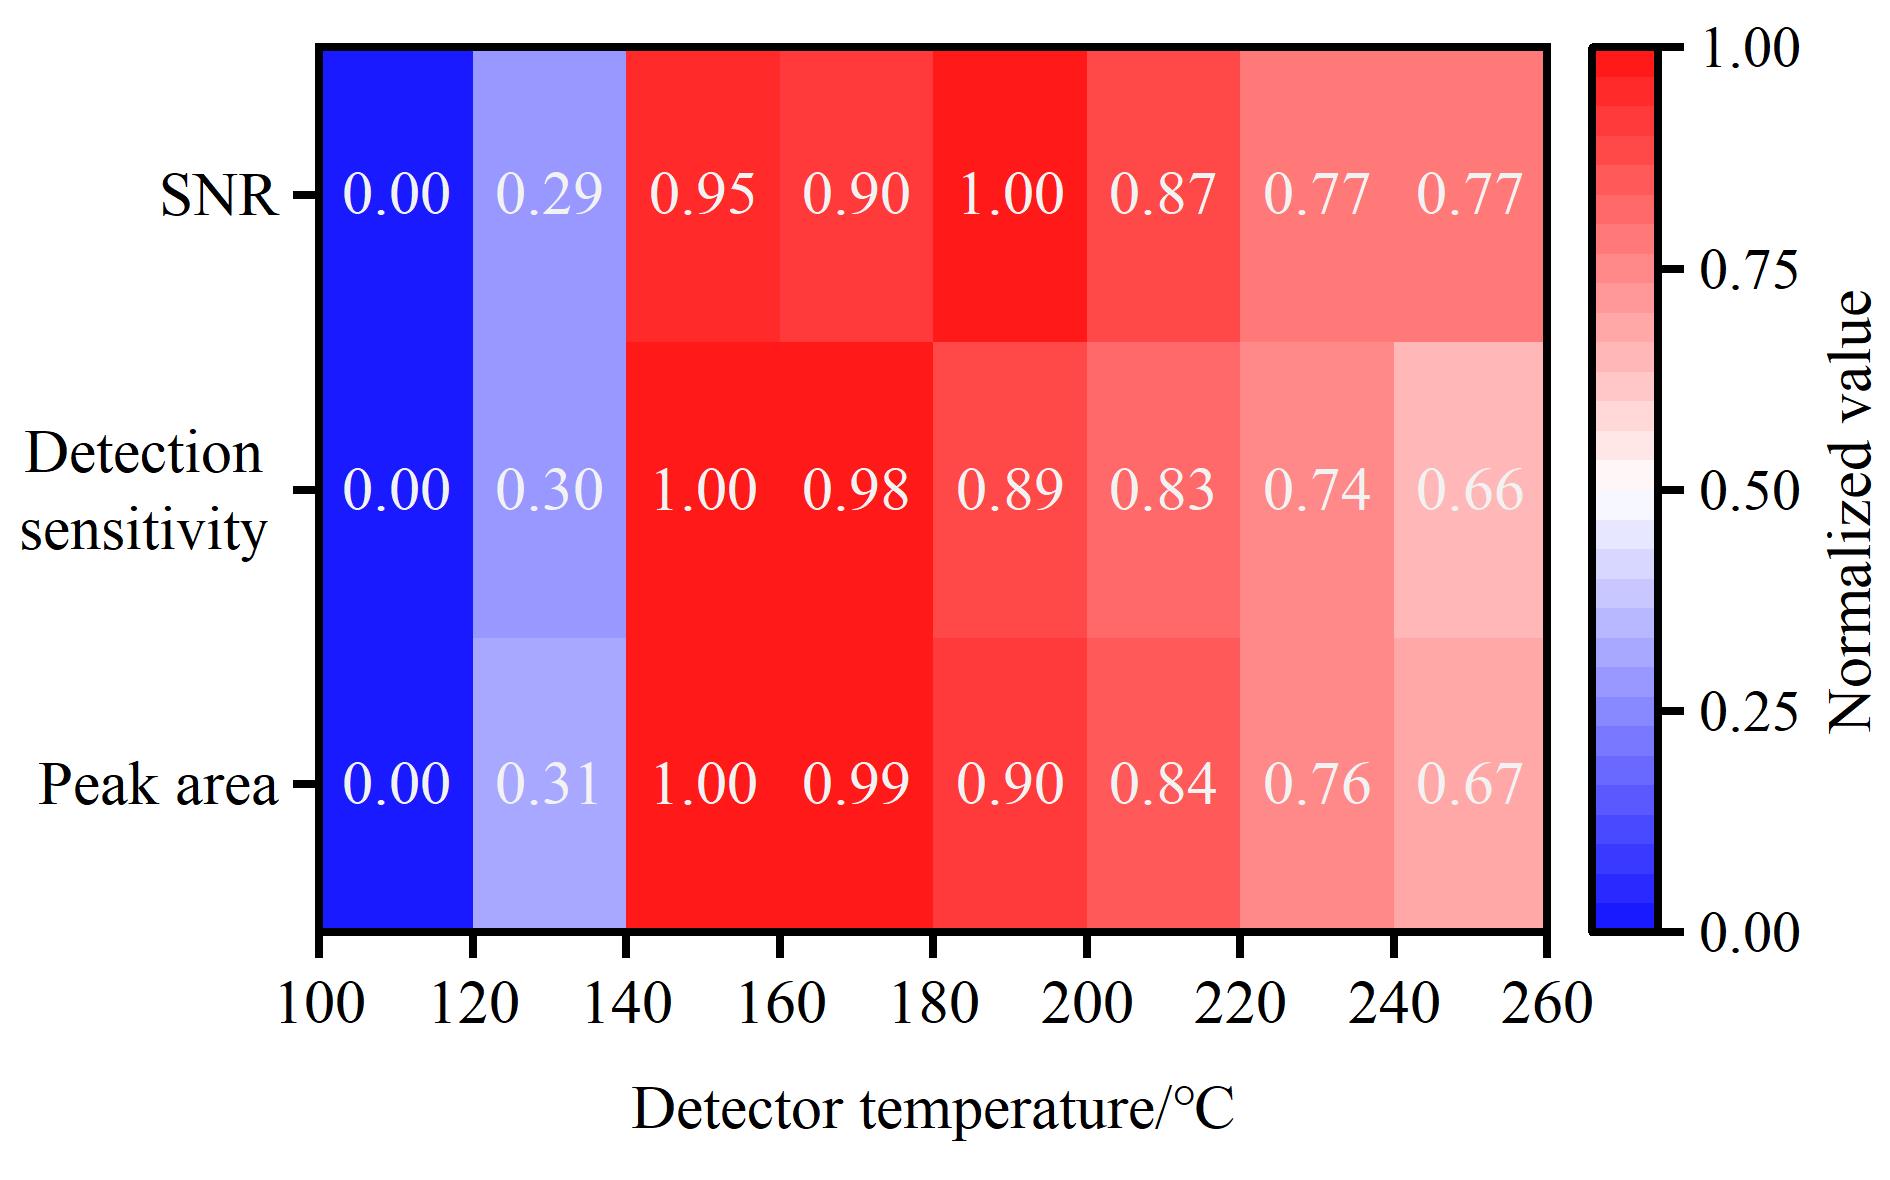
Fig. 13 Heat map of peak area, detection sensitivity, and SNR as a function of temperature (data normalized)
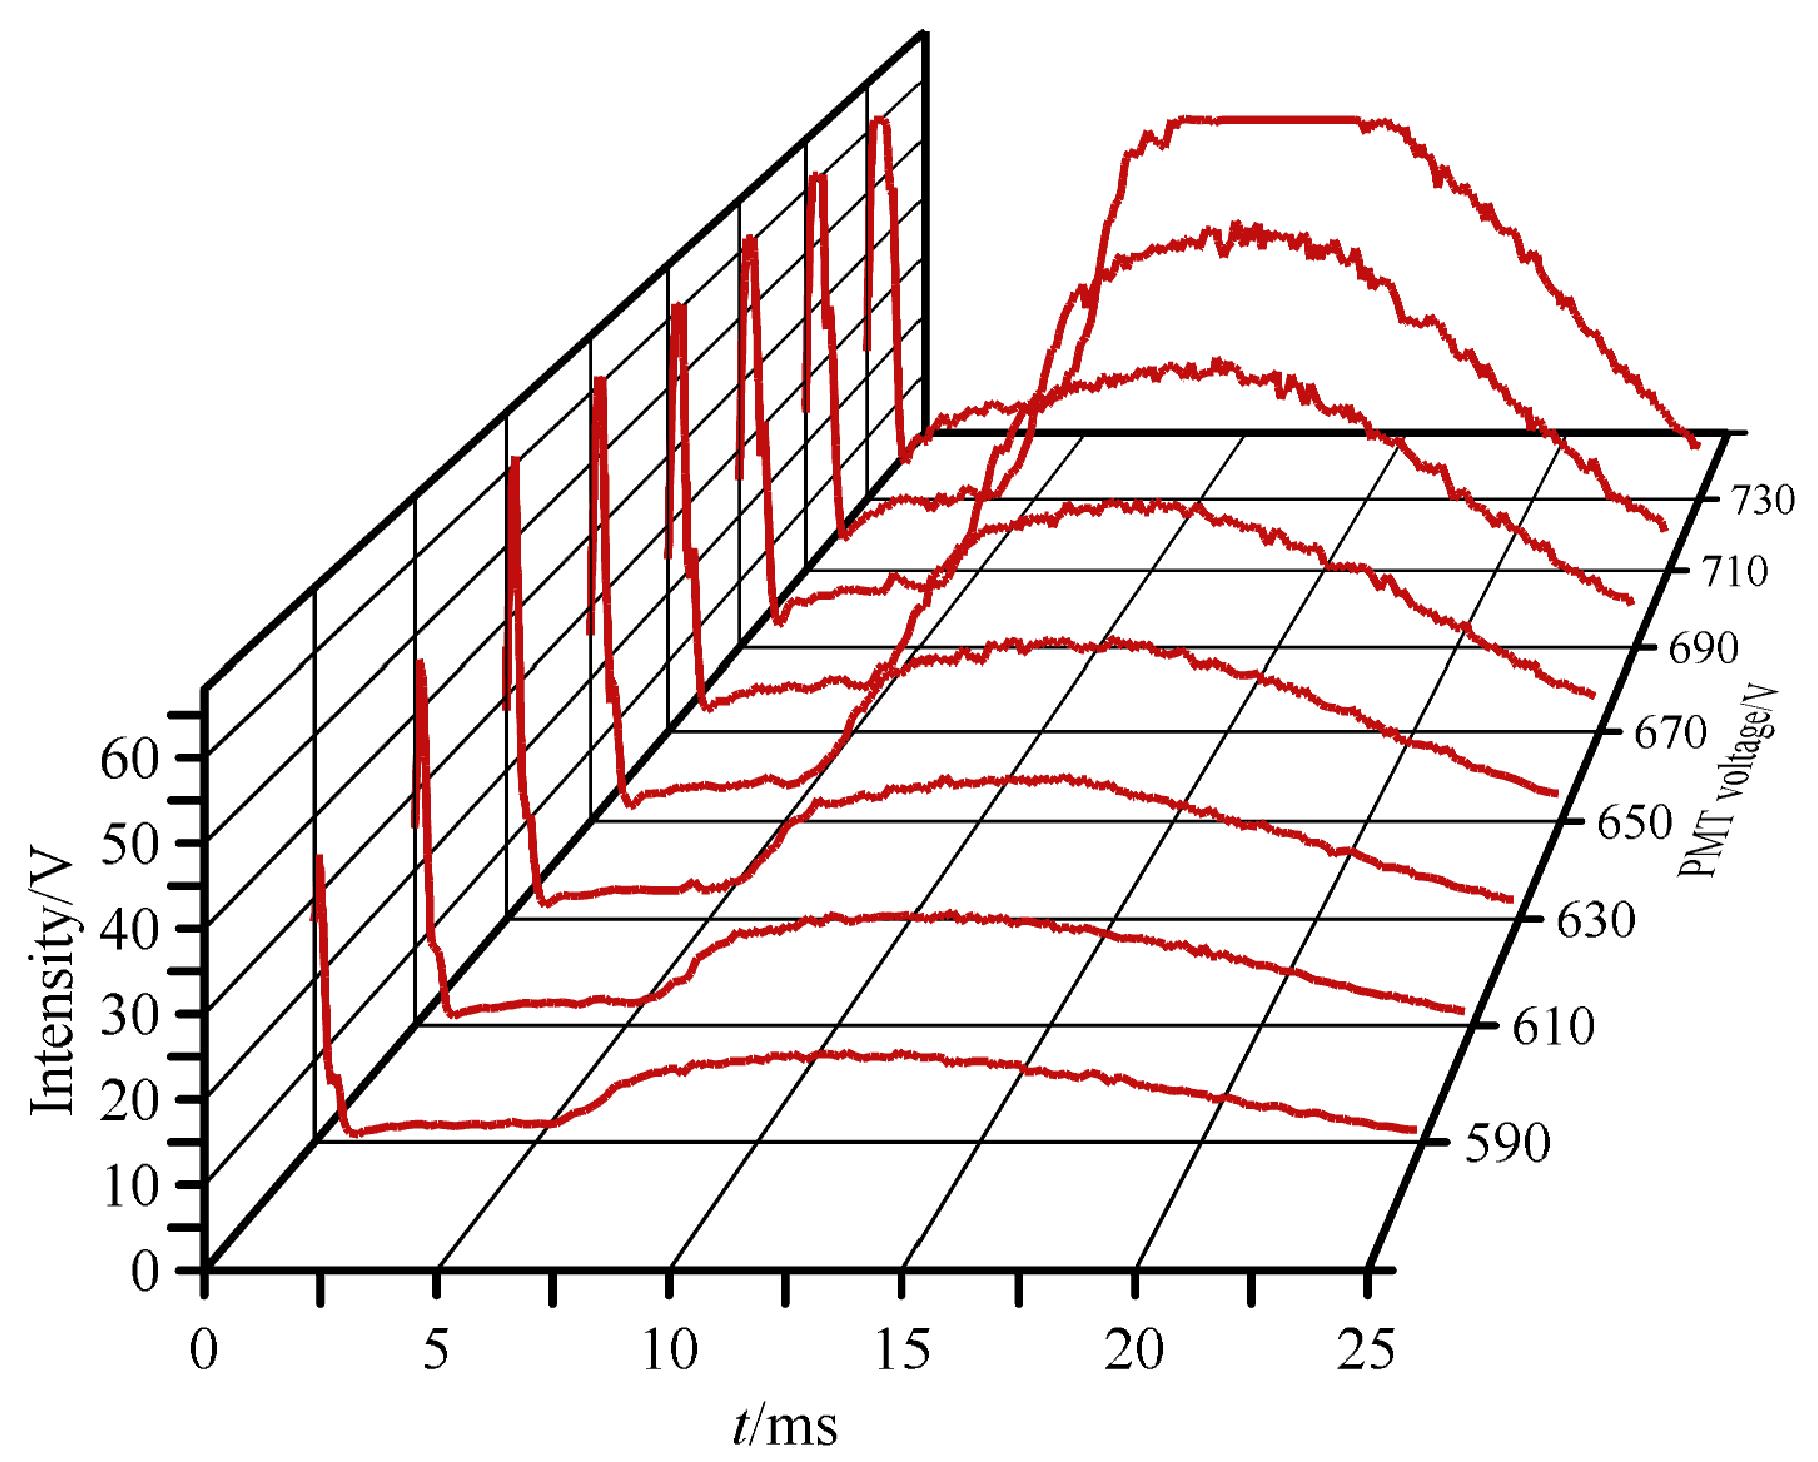
Fig. 14 Three-dimensional overlay of sulfur luminescence response at different PMT voltagesConditions are the same as in Fig. 12.
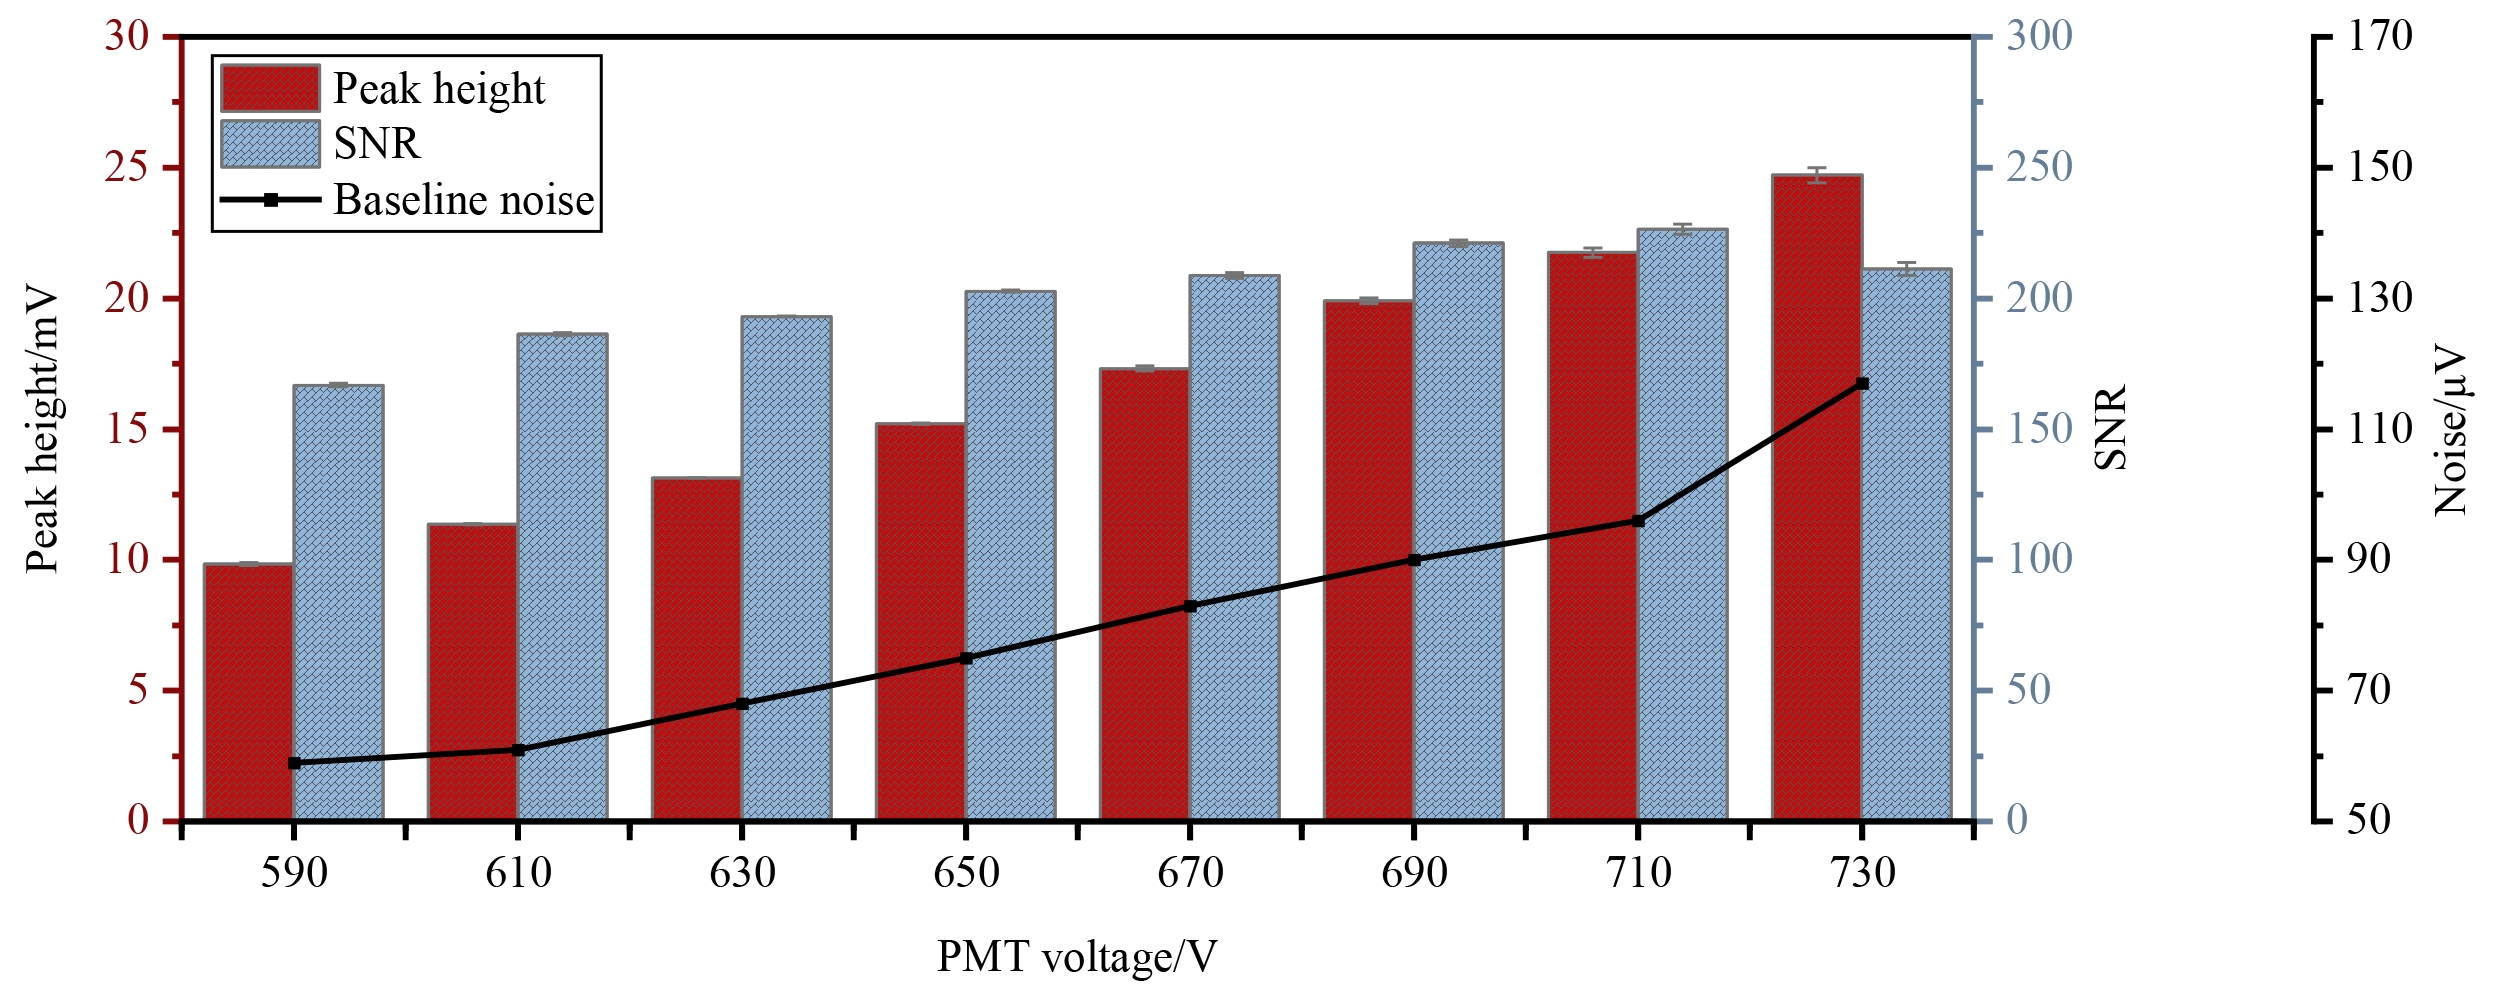
Fig. 15 Peak height, SNR, and baseline noise versus PMT voltageThe error bars on the peak height and SNR bars represent the standard deviation (SD) of repeated measurements (n=7). All error bars are shown on the original measurement scale without any amplification.
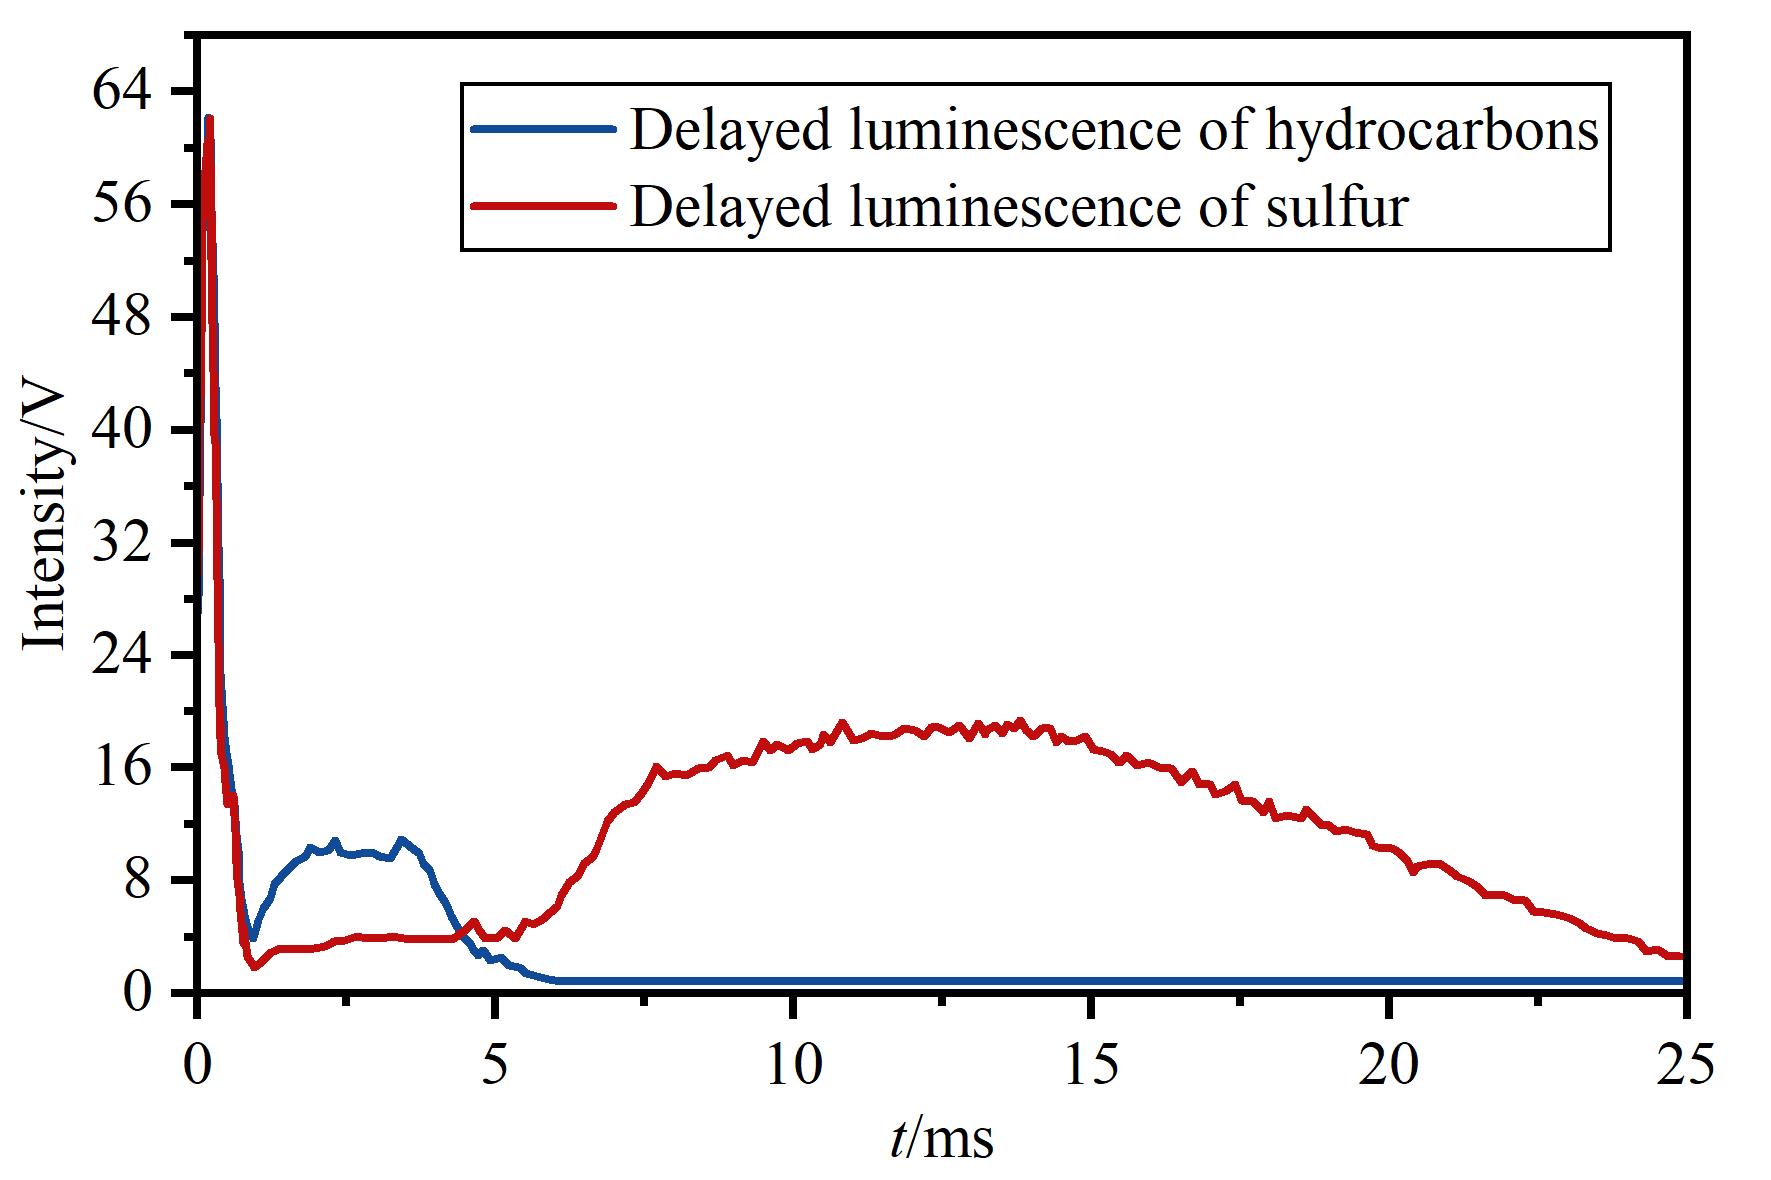
Fig. 16 Time-resolved delayed luminescence response curves of hydrocarbons and sulfur in the PFPD
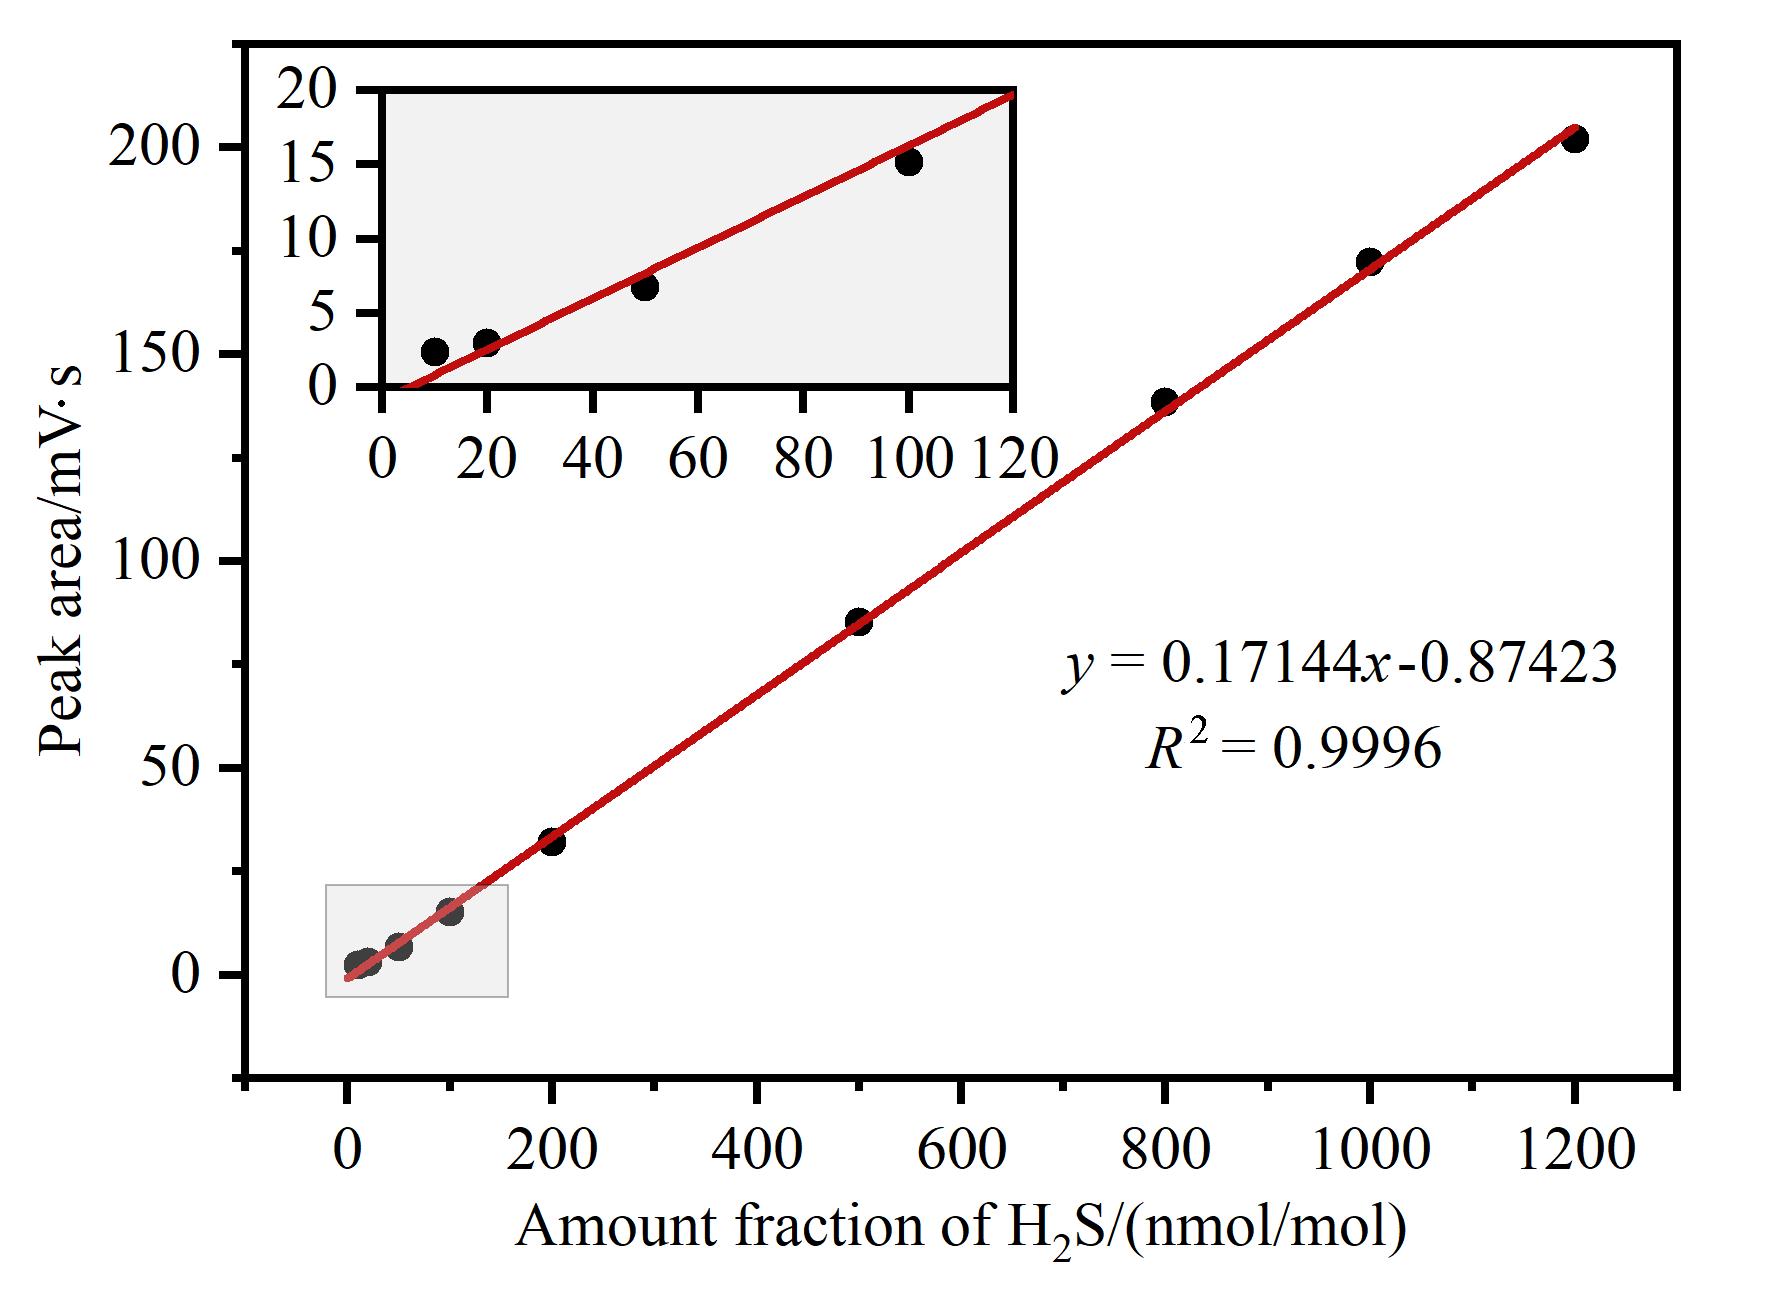
Fig. 17 Linear calibration curve of sulfur-channel peak area versus H2S amount fraction for the PFPD
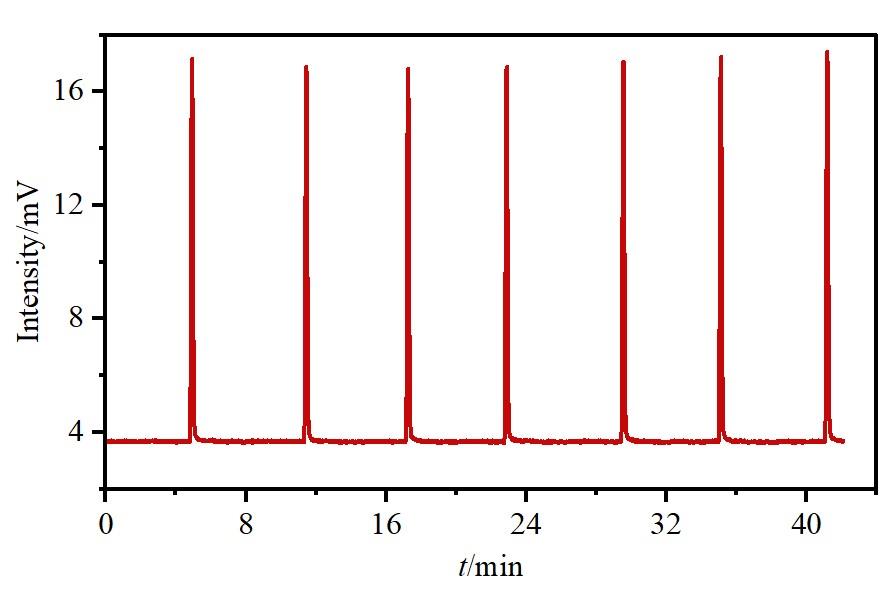
Fig. 18 Chromatograms of seven consecutive injections of 1.1 μmol/mol H₂S
| Detector | Sulfur detection limit/(g/s) | Linear range | Quantitative repeatability |
|---|---|---|---|
| PFPD developed in this work | 4.1×10⁻¹³ | 2 orders of magnitude | 0.37% (1.1 μmol/mol H₂S) |
| 5383 PFPD[ | 1×10-12 | 2.4 orders of magnitude | 11% (0.657 μmol/mol H₂S) |
| Nexis FPD-2030[ | 2×10-12 | 3 orders of magnitude | 0.91% (1 μmol/mol thiophene) |
Table 4 Comparison of the main performance metrics of the developed PFPD and commercial sulfur detectors
| Detector | Sulfur detection limit/(g/s) | Linear range | Quantitative repeatability |
|---|---|---|---|
| PFPD developed in this work | 4.1×10⁻¹³ | 2 orders of magnitude | 0.37% (1.1 μmol/mol H₂S) |
| 5383 PFPD[ | 1×10-12 | 2.4 orders of magnitude | 11% (0.657 μmol/mol H₂S) |
| Nexis FPD-2030[ | 2×10-12 | 3 orders of magnitude | 0.91% (1 μmol/mol thiophene) |
|
| [1] | XU Xiaomin, ZHANG Jingshun, CAI Zengxuan, ZHANG Jing, HUANG Baifen, XU Jiaojiao, CHEN Qing. Determination of amanitins and phallotoxins in wild mushrooms by online liquid chromatography-diode array detector-tandem mass spectrometry [J]. Chinese Journal of Chromatography, 2017, 35(6): 613-619. |
| Viewed | ||||||
|
Full text |
|
|||||
|
Abstract |
|
|||||


